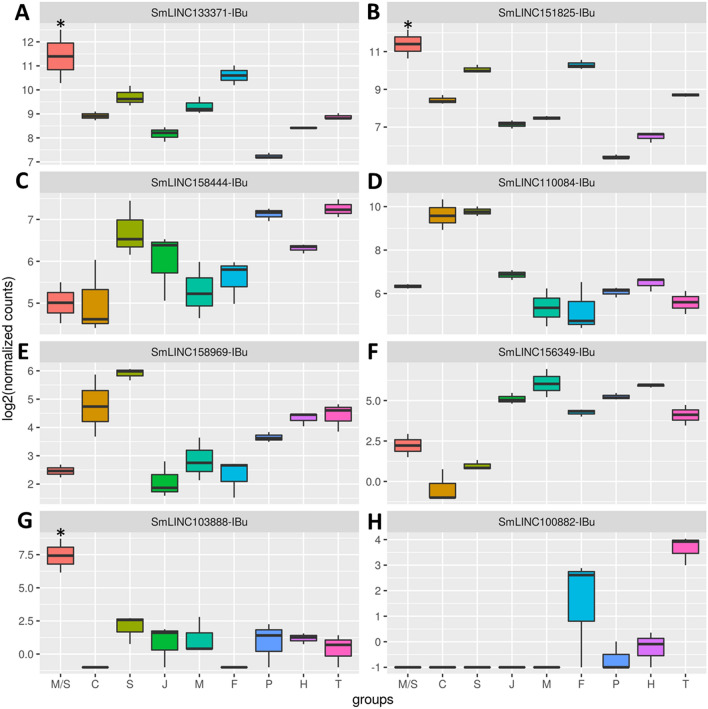
Figure 6.
RNA-seq expression profiles at different S. mansoni stages of selected lincRNAs differentially expressed after 5-AzaC treatment (491 µM). The expression levels (shown as log2 of normalized counts) of the eight lincRNAs whose gene IDs are indicated at the top of each panel are shown. These lincRNAs were selected after re-analysis of RNA-Seq public datasets of 5-AzaC treated S. mansoni females16. The y-axis shows the expression level for each lincRNA in the RNA-seq assays (log2 of normalized counts) as determined at the stage indicated in the x-axis as follows: miracidia/sporocysts (M/S), cercariae (C), schistosomula (S), juveniles (J), adult males (M), adult females (F), posterior somatic tissues (P), heads (H) and tails (T). (A) SmLINC133371-IBu; (B) SmLINC151825-IBu; (C) SmLINC158444-IBu; (D) SmLINC110084-IBu; (E) SmLINC158969-IBu; (F) SmLINC156349-IBu; (G) SmLINC103888-IBu; (H) SmLINC100882-IBu. Only transcripts that were upregulated in one stage/tissue when compared with all others were considered as significantly more expressed in that stage/tissue and are marked with an asterisk. *p value < 0.05.

