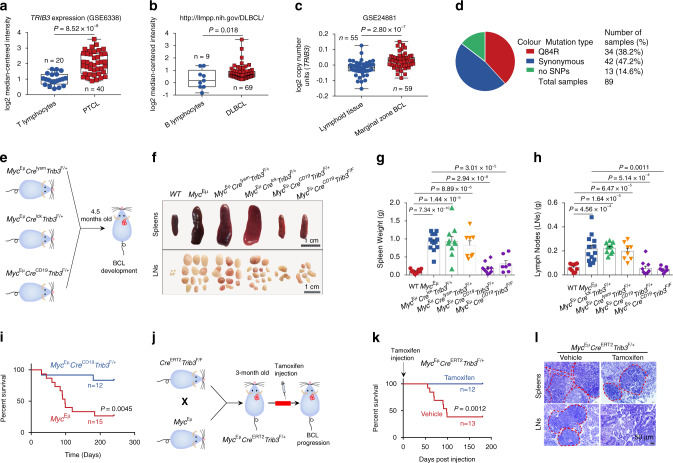
Fig. 1. TRIB3 promotes B cell lymphomagenesis.
a, b The mRNA level of TRIB3 in lymphoma patients and the corresponding control groups. The center line indicates the median, bounds of box = 25th and 75th percentiles; bars = 10th and 90th percentiles; whiskers = min to max, show all points. Statistical significance was determined by two-tailed Student’s t test. P values: 8.52 × 10⁻⁸ a; 0.018 b. c TRIB3 gene copy numbers in the lymphoma set (GSE24881) were analyzed at the Oncomine website. The center line indicates the median, bounds of box = 25th and 75th percentiles; bars = 10th and 90th percentiles; whiskers = min to max, show all points. Statistical significance was determined by two-tailed Student’s t test. P value: 2.80 × 10⁻⁷. d Pie chart showing all the types and statistics of TRIB3 gene mutation in 89 lymphoma patients. e Schematic strategy for studying the development of B cell lymphoma (BCL) in MycEμ mice with myeloid cell-specific deletion of Trib3 (MycEμCreLysmTrib3F/+), thymocyte-specific deletion of Trib3 (MycEμCreLckTrib3F/+), or B lymphocyte-specific deletion of Trib3 (MycEμCreCD19Trib3F/+). f Representative spleens and lymph nodes (LNs) obtained from WT, MycEμ, MycEμCreLysmTrib3F/+, MycEμCreLckTrib3F/+, MycEμCreCD19Trib3F/+, or MycEμCreCD19Trib3F/F mice (4.5 months old). Scale bar, 1 cm. g, h The data indicate the spleen and LN weights of WT (n = 10), MycEμ (n = 13), MycEμCreLysmTrib3F/+ (n = 8), MycEμCreLckTrib3F/+(n = 10), MycEμCreCD19Trib3F/+ (n = 10), or MycEμCreCD19Trib3F/F mice (n = 7) (4.5 months old). Data are represented as means ± SEM. Statistical significance was determined by two-tailed Student’s t test. P values: 7.34 × 10⁻¹⁰ (WT vs. MycEμ), 1.44 × 10⁻⁵ (WT vs. MycEμCreLckTrib3F/+), 8.89 × 10⁻⁶ (WT vs. MycEμCreLysmTrib3F/+), 2.94 × 10⁻⁸ (MycEμ vs. MycEμCreCD19Trib3F/+), 3.01 × 10⁻⁵ (MycEμ vs. MycEμCreCD19Trib3F/F) g; 4.56×10⁻⁴ (WT vs. MycEμ), 1.64 × 10⁻⁵ (WT vs. MycEμCreLckTrib3F/+), 6.47 × 10⁻⁵ (WT vs. MycEμCreLysmTrib3F/+), 5.14× 10⁻⁴ (MycEμ vs. MycEμCreCD19Trib3F/+), and 0.0011 (MycEμ vs. MycEμCreCD19Trib3F/F) h. i Kaplan–Meier survival curves for MycEμ (n = 15) and MycEμCreCD19Trib3F/+ mice (n = 12). Statistical difference was determined by two-sided log-rank test. P value: 0.0045. j Schematic representation of generating the inducible deletion of Trib3 in MycEμ mice (MycEμCreERT2Trib3F/+). k Kaplan–Meier survival curves for MycEμCreERT2Trib3F/+ mice treated with vehicle (n = 13) or tamoxifen (n = 12 per group, 250 mg/kg). Statistical difference was determined by two-sided log-rank test. P value: 0.0012. l Representative H&E staining of the spleens and LNs of 5-month-old MycEμCreERT2Trib3F/+ mice treated with or without tamoxifen. Scale bar, 50 μm. The data are presented as presentative from three independent experiments. The MycEμCreLysmTrib3F/+, MycEμCreLckTrib3F/+, MycEμCreCD19Trib3F/+, MycEμCreCD19Trib3F/F, and MycEμCreERT2 mice are heterozygous for the MycEμ allele. Source data are provided as a Source Data file.

