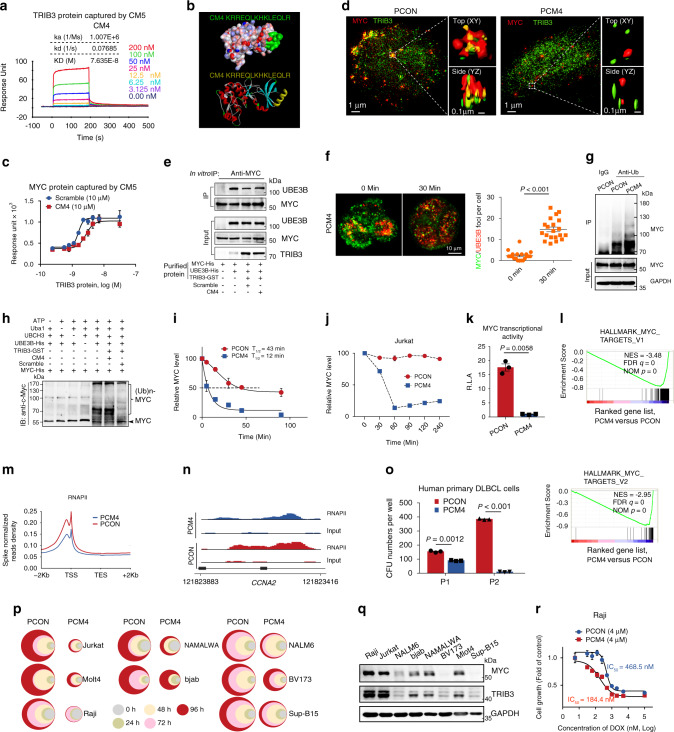
Fig. 6. Disturbing the TRIB3/MYC interaction destabilizes MYC and inhibits lymphoma.
a The kinetic interaction of CM4 and TRIB3 was determined by surface plasmon resonance (SPR) analyses. b The highest scoring Dock model of the CM4 and TRIB3 complex is shown. Upper: the surface of CM4 (green) and the TRIB3 complex. Below: the 3D structure of CM4 (yellow) and the TRIB3 complex. c The kinetic interaction of the TRIB3 and MYC proteins was determined by SPR analyses with or without CM4. d Structured illumination microscopic (SIM) images of PCON- or PCM4-treated Raji cells (30 min) stained for MYC and TRIB3. Dotted line border square: area processed for 3D surface rendering (insets). e In vitro interaction assays show that the CM4 peptide increased the binding of MYC and UBE3B. f Representative images of MYC and UBE3B foci (left) and quantification of the number of MYC/UBE3B colocalized foci in Raji cells before and after PCM4 treatment. Scale bar, 10 μm. Data are represented as means ± SEM. Statistical significance was determined by two-tailed Student’s t test. P value: 3.74 × 10⁻¹³. g Effect of PCM4 on MYC ubiquitination. Extracts of PCON- and PCM4-treated Raji cells were IP with an anti-Ub Ab. Ubiquitinated MYC was detected by immunoblotting. h In vitro ubiquitination assays show that the CM4 peptide restored the polyubiquitination of MYC. i Effect of PCM4 on MYC protein degradation. Raji cells were treated with CHX (10 μg/mL) and the PCON or PCM4 peptide (4 μm) for the indicated times. The protein abundance of MYC was detected by immunoblotting. j Effect of PCM4 treatment on MYC protein levels. Jurkat cells were treated with PCON or PCM4 for the indicated times (4 μm). The protein expression of MYC was detected by immunoblotting. k The transcriptional activity of MYC in Raji cells treated with PCON or PCM4. PCON- or PCM4-treated Raji cells were transfected with the reporter genes with MYC transcriptional activity. After 24 h of transfection, luciferase activities were measured. Data are represented as means ± SEM. Statistical significance was determined by two-tailed Student’s t test. P value: 0.0058. l GSEA shows global downregulation of MYC target genes in PCM4-treated versus PCON-treated cells. m Metagene plots of global RNAPII occupancy at gene bodies in PCON- or PCM4-treated Raji cells. n ChIP-sequencing tracks for CCNA2 from PCM4-treated cells versus PCON-treated cells normalized to spike-in controls. o PCM4 decreased the serial colony formation ability (P1 and P2) of primary human DLBCL cells (T69). Data are represented as means ± SEM. Statistical significance was determined by two-tailed Student’s t test. P value: 0.0012, 3.403 × 10⁻⁵. p Effects of PCM4 on the cell viabilities of the indicated lymphoma and leukemia cells for the indicated times. The colors represent different time points; the diameter indicates the relative cell viability. q Expression of MYC and TRIB3 in the indicated cells. r The synergetic effect of PCM4 and DOX on the cell viability of Raji cells. Source data are provided as a Source Data file.

