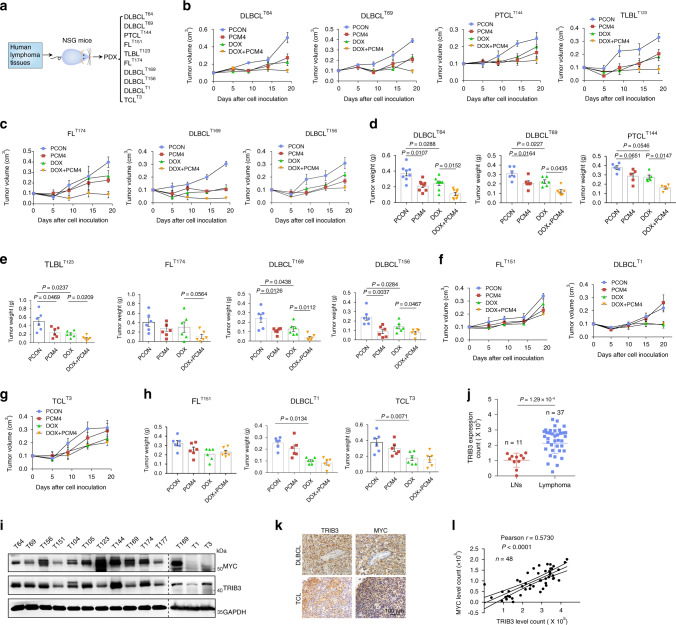
Fig. 8. Combination of PCM4 with doxorubicin inhibits synergistically lymphoma in PDX models.
a Strategy for constructing patient-derived tumor xenograft (PDX) models from lymphoma patients. b, c Effects of the indicated treatments on tumor growth in the indicated PDX models. Tumors were subcutaneously engrafted in NSG mice (n = 8 per group). One day later, the mice were treated with PCM4 (5 mg/kg) or/and DOX (2 mg/kg) for 21 days, and the tumors were measured twice a week. Data are represented as means ± SEM. d, e Effects of the indicated treatments on the tumor weights in the indicated PDX models. (DLBCLT64 n = 8 per group, DLBCLT69 n = 6 per group, PTCLT144 n = 5 per group, TLBLT123 n = 6 per group, FLT174 n = 6 per group, DLBCLT169 n = 6 per group, DLBCLT156 n = 6 per group). Data are represented as means ± SEM. Statistical significance was determined by two-tailed Student’s t test. P values were indicated in the panels d and e. f–h Effects of the indicated treatments on the tumor growth and tumor weights in the indicated PDX models. (FLT151 n = 6 per group, DLBCLT1 n = 6 per group, TCLT3 n = 6 per group). Data are represented as means ± SEM. P values were indicated in the panel h. i The expression of MYC and TRIB3 in 13 primary lymphoma cells was detected by western blotting. The dashed line showed the two gels which were probed in parallel. The data are representative of three independent assays. j Statistical analyses of IHC staining of TRIB3 in human lymphoma (n = 37 samples) and benign lymph node (LN) tissues (n = 11 samples). TRIB3 expression was assessed as integrated optical density (IOD) scores. The horizontal lines shown in the graphs represent the median of each protein expression level. The data are presented as the means ± SEM. Statistical significance was determined by two-tailed Student’s t test. P value: 1.29 × 10⁻⁸. k Representative images of IHC staining of TRIB3 and MYC in human lymphoma tissues. The data are representative of three independent assays. Scale bars, 100 μm. l Correlation between TRIB3 and MYC expression in human LNs and lymphoma specimens (n = 48). Each data point represents the value from an individual patient. Statistical significance was measured by Pearson’s correlation test. Source data are provided as a Source Data file.

