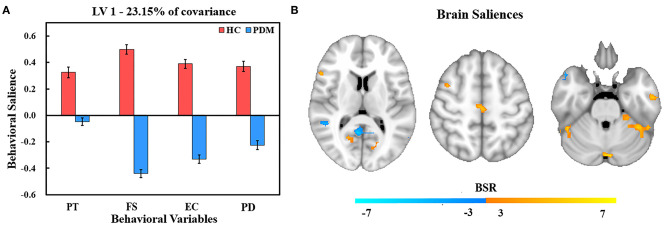
Figure 1.
PLS correlation analysis results of LV 1. (A) Bar graph of behavioral salience with stability estimated using the bootstrap method in the two studied groups. (B) Resting brain activity showing brain regions in which variations were associated with trait empathy. The map is generated with the threshold set at p = 0.01 (BSR = ±3). In the HC group, warm regions indicated a positive correlation between resting brain activity, empathy scores, and cool regions showed a negative correlation between the resting brain activity and empathy scores. In contrast, the association was reversed in the PDM group (warm, negative correlation; cool, positive correlation). PT, perspective taking; FS, fantasy; EC, empathic concern; PD, personal distress.

