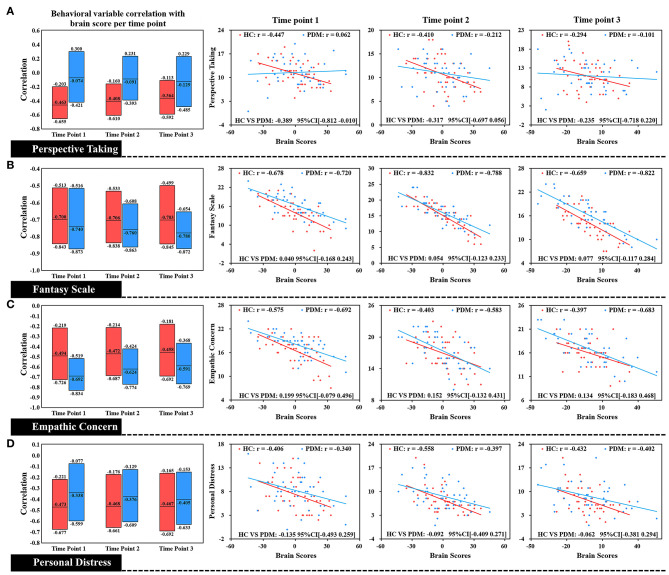
Figure 4.
Correlation of each level of trait empathy with brain scores of LV 2. In the box plot, the middle line of the box is the original correlation between empathy and brain score in the same phase. The boundary of the box was the 95% CI of the trait empathy correlation with brain scores based on the use of 5,000 bootstraps. The original correlation between empathy and brain score is shown by the scatter plot. There were no significant differences between HC and PDM in the EC, FS, and PD correlations with brain scores at the periovulatory, luteal, and menstruation phases based on effect-size analysis. The correlations in both groups did not significantly change during the three phases.

