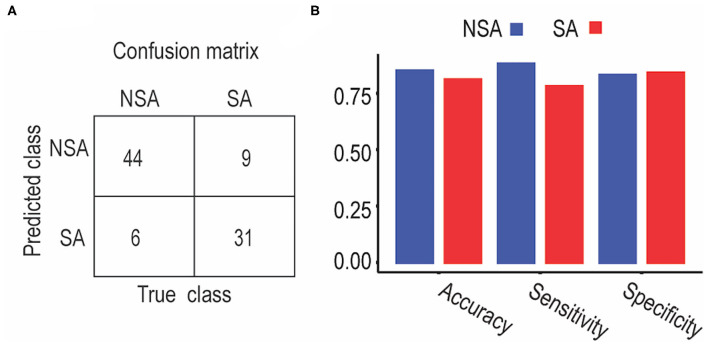
Figure 3.
Classification performance between SA and NSA patients using support vector machine. (A) Classification confusion matrices. Each row of the matrix represents the occurrences in an actual class, while each column represents the occurrences in a predicted class. (B) Classification accuracy, sensitivity, and specificity for NSA and SA, respectively.

