Figure 5.
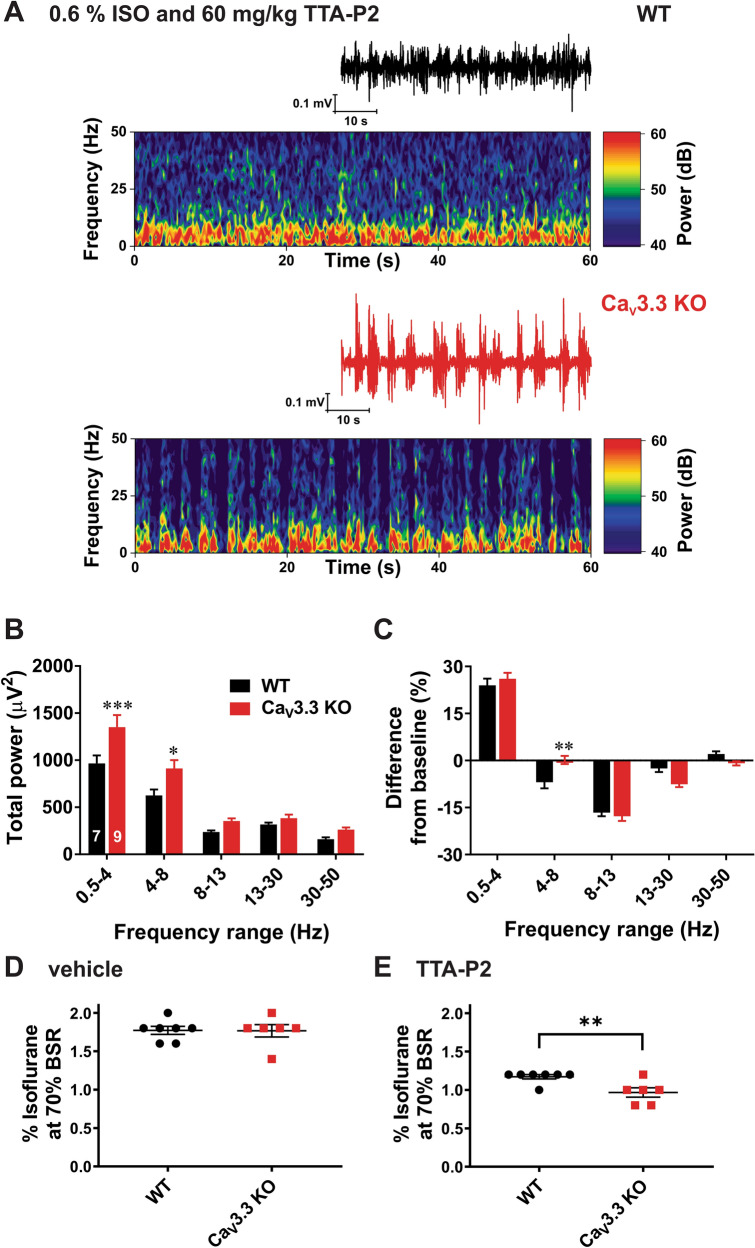
Oscillatory differences between the WT and CaV3.3 KO mice pretreated with TTA-P2 during administration of sub-hypnotic concentrations of isoflurane. (A) Representative EEG traces and heat maps from a WT mouse (upper panel) and a CaV3.3 KO mouse (lower panel) during administration of 0.6% isoflurane (ISO) following pretreatment with TTA-P2 at 60 mg/kg i.p. (B) Analysis of total power showed a rise in slow frequency range (δ and θ range) in the mutant mice in comparison with the WT group (two-way RM ANOVA: Interaction F4,56 = 4.11, p = 0.005, Frequency F4,56 = 137.40, p < 0.001, Strain F1,14 = 6.89, p = 0.02; Bonferroni post hoc was presented on figure where ***p = 0.0007, and *p = 0.017). (C) Relative power during 0.6% isoflurane following pretreatment with TTA-P2 at 60 mg/kg i.p in WT and mutant mice relative to power during wakefulness (two-way RM ANOVA: Interaction F4,56 = 4.41, p = 0.004, Frequency F4,56 = 188.20, p < 0.001, Strain F1,14 = 0.26, p = 0.615; Bonferroni post hoc was presented on figure where **p = 0.004). (D) Animals from two cohorts pretreated with 15% cyclodextrin did not show difference in isoflurane requirements to achieve 70% BSR (unpaired two-tailed t-test: t11 = 0.051, p = 0.960). E) Mutant animals pretreated with 60 mg/kg TTA-P2 achieve 70% BSR with significantly lower isoflurane concentration than the WT group (unpaired two-tailed t-test: t11 = 3.177, **p = 0.009). All images were generated using GraphPadPrism8 software (https://www.graphpad.com/scientific-software/prism/).

