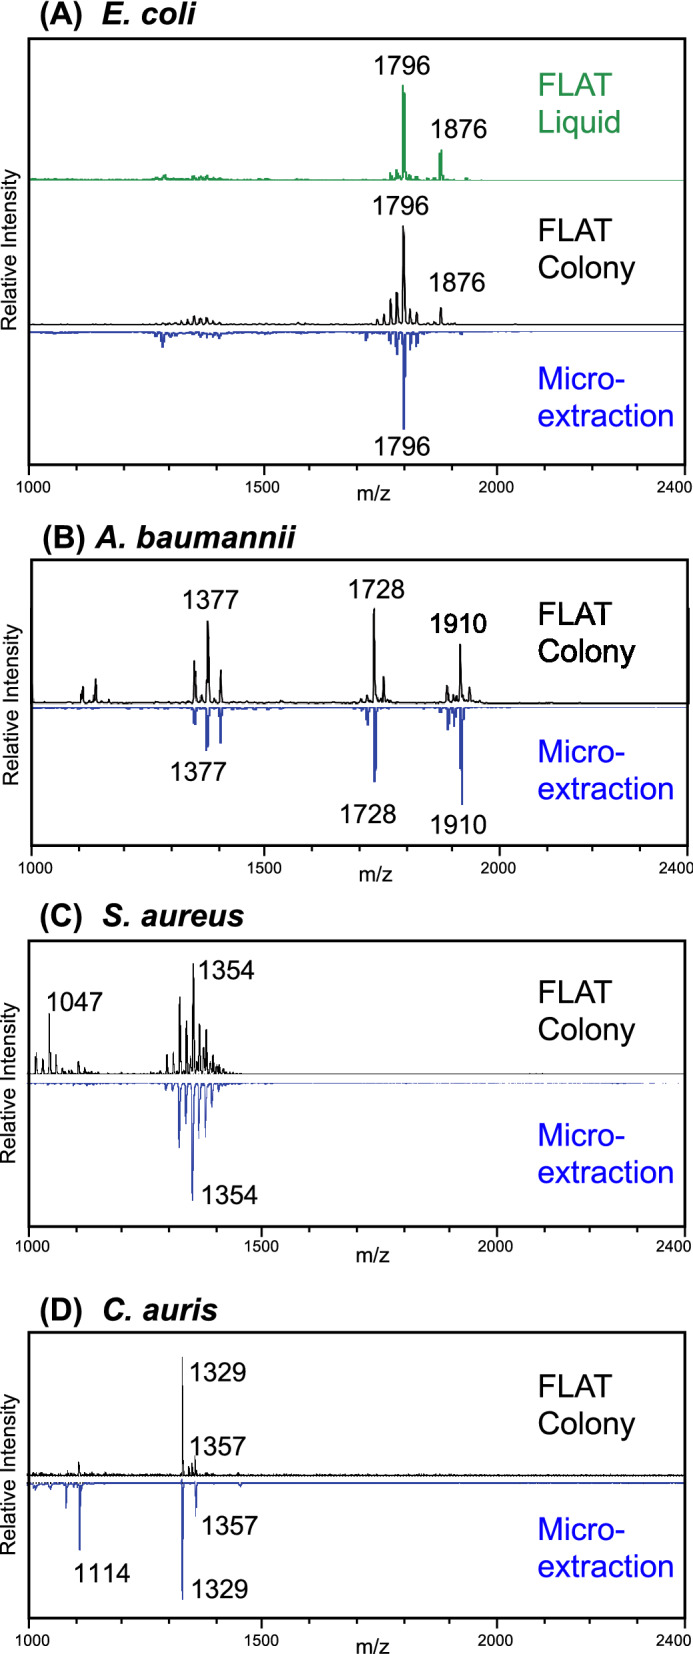
Figure 2.

Representative FLAT spectra compared to microextractions spectra of the same strain. (A) Escherichia coli ATCC 25922 colony smear and liquid culture via FLAT is compared to microextraction. The characteristic 1796 m/z lipid A ion28 is observed in all spectra. Additionally, an ion at 1876 m/z is observed with FLAT, but not with microextraction. This is plausibly a lipid A ion, and may have been previously observed in E. coli28, but is not typically extracted via microextraction. Colony smears via FLAT are compared to microextraction in (B) through (D), with the same base peak shown for both methods for each species. (B) Acinetobacter baumannii SM1536. Previously reported ions16 are observed. (C) Staphylococcus aureus NRS484. The pattern of ions from 1300 to 1400 m/z is highly similar in both methods. An ion at 1047 m/z in FLAT may be present at very low intensity in microextraction. (D) Candida auris AR0384. Two ions at 1329 and 1357 m/z are present in both spectra. An ion at 1114 m/z in microextraction may be present at low intensity in FLAT.
