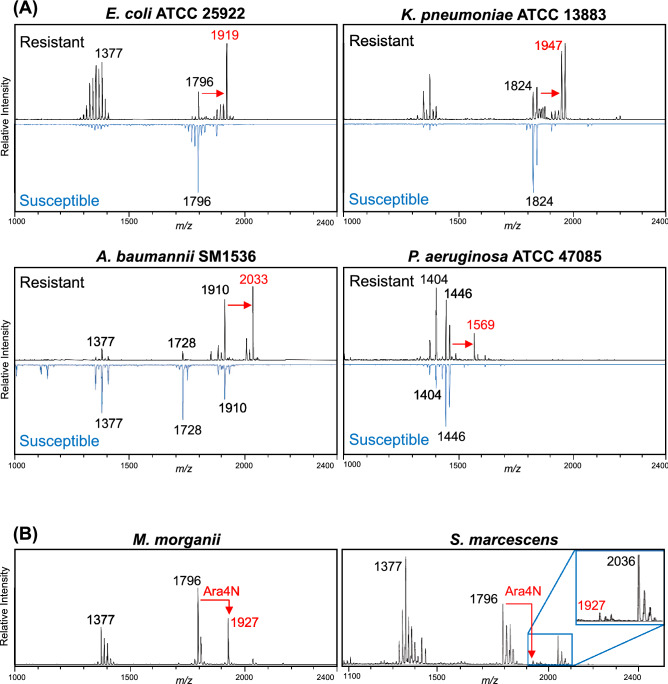
Figure 3.
Detection of antibiotic resistance. (A) FLAT was used on isolates expressing the gene mcr-1 from a plasmid leading to colistin resistance via phosphoethanolamine (PEtN) addition to lipid A (observed as Δm/z 123, shown in red). In resistant spectra, the intensity of the unmodified lipid A base peak is less than that of the modified ion, increasing the relative intensity of other ions in the spectra, especially ions between 1300 and 1400 m/z in E. coli and K. pneumonia. This effect is not clear in A. baumannii and P. aeruginosa, because in each case the intensity of the most prominent unmodified lipid A ion is similar to the intensity of the modified ion. (B) Intrinsically colistin-resistant bacteria Morganella morganii and Serratia marcescens were analyzed via FLAT for resistance-associated peaks. Lipid A modification with l-amino-4-arabinose (Ara4N) was observed (as Δm/z 131) in M. morganii spectra. Lipid A modification with Ara4N was observed (as Δm/z 131) in both species.

