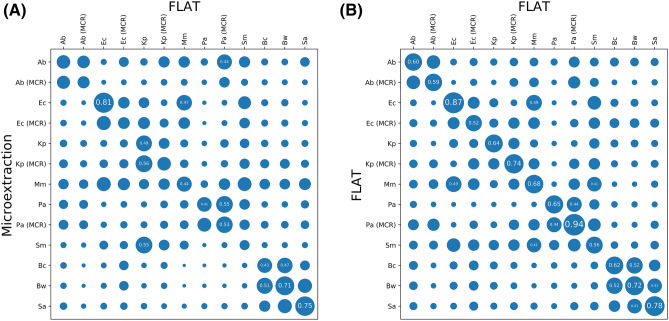
Figure 4.
FLAT spectra are distinctive by bacterial species and similar to equivalent Microextraction spectra. (A) A heatmap demonstrating that FLAT produces spectra consistent with microextraction. (B) A heatmap demonstrating FLAT species and mcr-1 status differentiation. In both cases, similarity between two groups of spectra was computed via the mean cosine similarity across all pairs of spectra, and is visualized as a circle with a proportionally scaled diameter. A total of 149 FLAT spectra and 148 microextraction spectra were used in this comparison, from strains and samples as described in Supplementary Tables S1 and S2 online. CR: mcr-1 transformed; Ab: Acinetobacter baumannii; Ec: Escherichia coli; Kp: Klebsiella pneumoniae Pa: Pseudomonas aeruginosa; Mm: Morganella morganii; Sm: Serratia marcescens; Bc: Bacillus cereus; Bw: Bacillus mycoides (previously known as Bacillus weihenstephanensis37); Sa: Staphylococcus aureus.

