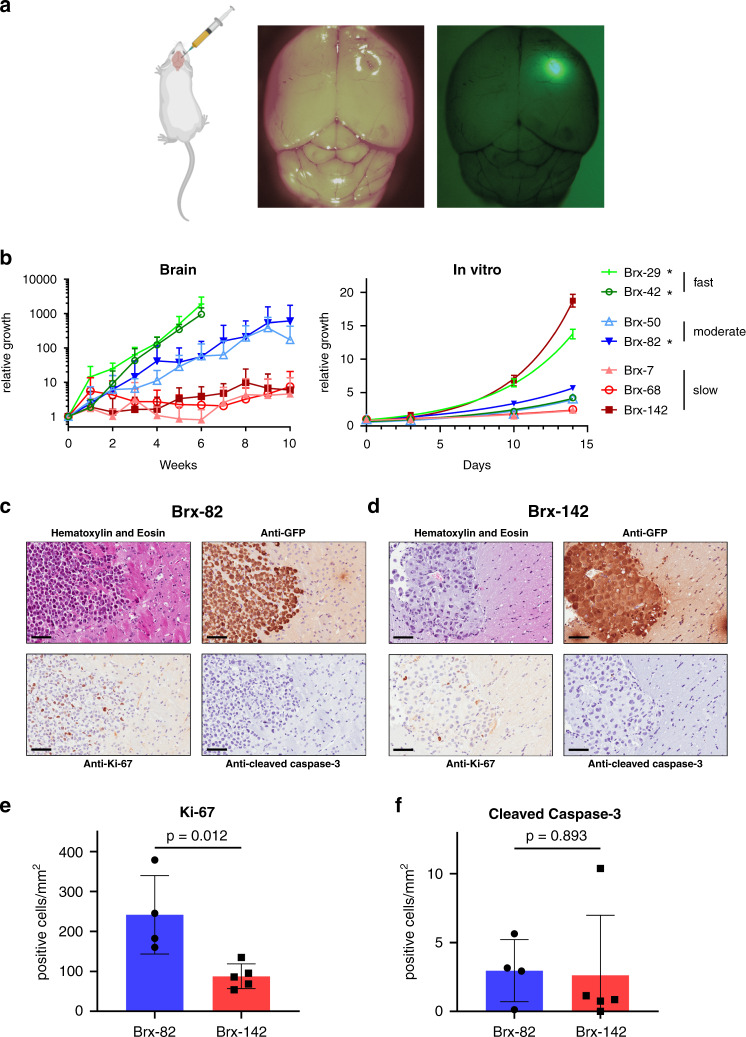
Fig. 1. Breast cancer CTC lines generate tumors after stereotactic brain injection.
a CTC lines were stereotactically injected into mouse right frontal lobes. CTCs were labeled with GFP and luciferase, allowing for tumor growth monitoring via in vivo imaging and for tumor identification ex vivo. b Growth rates of CTCs after stereotactic injection into mouse brains or in vitro. CTC lines were categorized as fast, moderate, or slow growth based on their brain growth rates (in vivo: Brx-7: n = 5, Brx-29: n = 3, Brx-42: n = 8, Brx-50: n = 7, Brx-68: n = 8, Brx-82: n = 4, Brx-142: n = 6; in vitro: n = 5). Brx-29 and Brx-42 brain growth data were censored at 6 weeks due to rapid tumor growth requiring euthanasia. *CTC lines derived from patients with brain metastases. c, d Representative sections of Brx-82 (c) or Brx-142 (d) brain tumor histology after staining with hematoxylin and eosin; or with anti-GFP, anti-Ki-67, or anti-cleaved caspase 3 antibody (brown) and counter-stained with hematoxylin. Scale bars: 70 μm. Images are representative of four tumor samples. e, f Quantitation of the number of cells positive for Ki-67 (e) or cleaved caspase-3 (f) per mm2 by immunohistochemical staining of brain tumor histologic sections (Brx-82: n = 4; Brx-142: n = 5). P values calculated by two-tailed unpaired t-test. Data for in vitro experiments represent mean ± SD and for in vivo experiments represent mean ± SEM. Source data are provided as a Source Data file.

