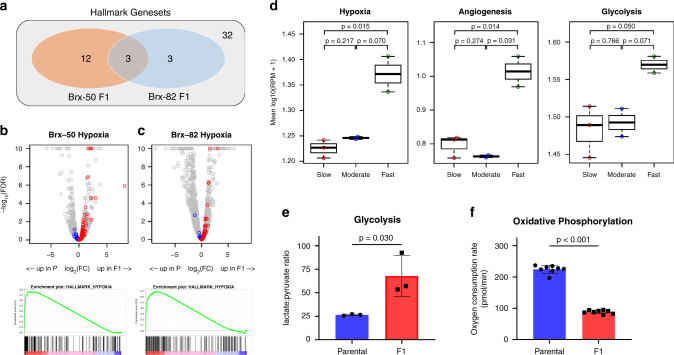
Fig. 3. Brain-proficient CTC lines demonstrate increased hypoxic signaling.
a Venn diagram of Gene Set Enrichment Analysis (GSEA) of transcripts upregulated in Brx-50 or Brx-82 F1 versus parental cells. Enriched genesets within the Hallmarks of Cancer gene sets from the Broad Molecular Signatures Database are highlighted. b, c Top panels: Volcano plots for expression of genes in Brx-50 (b) or Brx-82 (c) parental and F1 cells, as determined by RNA-seq. Genes in the Hallmarks of Cancer Hypoxia geneset from the Broad Molecular Signatures Database are colored, with blue indicating higher expression in parental cells and red indicating higher expression in F1 cells. Gray markers represent all genes not in the Hypoxia geneset. Genes with -log10(FDR) > 10 are displayed as −log10(FDR) = 10. Bottom panels: Enrichment plots of the Hallmarks of Cancer Hypoxia geneset for genes enriched in Brx-50 (b) or Brx-82 (c) F1 versus parental cells. Positive enrichment scores in enrichment plots indicate more enrichment of the geneset in F1 cells. d Mean expression of genes in the Hallmark of Cancer Hypoxia, angiogenesis, and glycolysis genesets in the seven parental breast cancer CTC lines, as determined by RNA-seq (Slow: Brx-7, Brx-68, Brx-142; Moderate: Brx-50, Brx-82; Fast: Brx-29, Brx-42). Boxplots display median, 25th percentile, and 75th percentile, with whiskers representing minimum and maximum. P values calculated by two-tailed unpaired t-test. e Lactate-to-pyruvate ratio in Brx-82 parental and F1 cells, as determined by metabolomic studies for relative levels of polar metabolites (n = 3). P value calculated by two-tailed unpaired t-test. f Oxygen consumption rate of Brx-82 parental and F1 cells, as determined by live-cell Seahorse assays (n = 8). P value (1.19 × 10⁻¹³) calculated by two-tailed unpaired t-test. Data represent mean ± SD. Source data are provided as a Source Data file.

