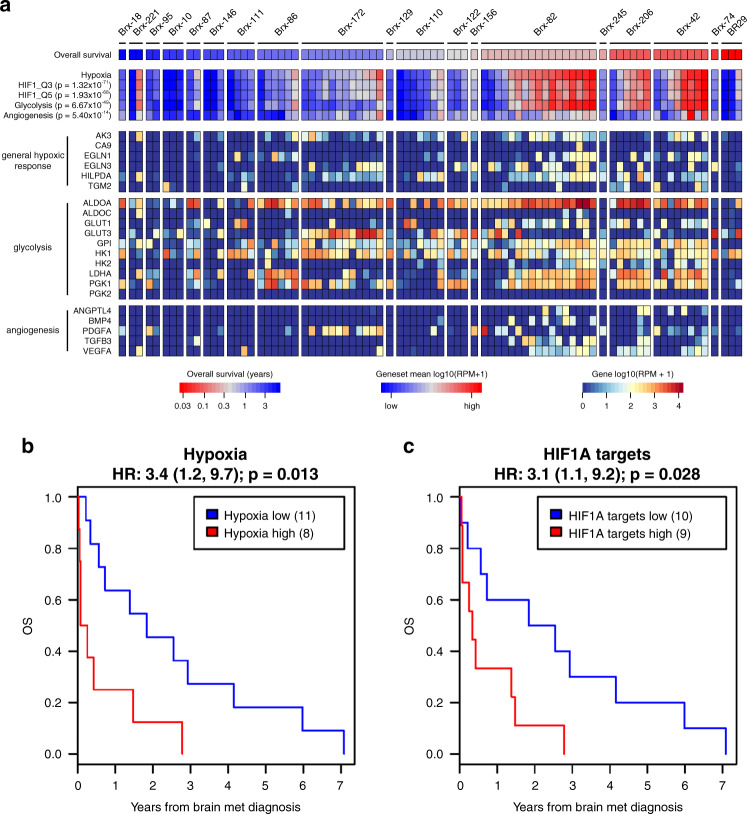
Fig. 6. Hypoxic signaling in CTCs predicts poor outcome in brain metastasis patients.
a RNA-seq from CTCs enriched from whole blood of breast cancer patients with brain metastases using the iChip microfluidic device24,25,32. Heat map of the expression level of canonical HIF1A target genes. The color bars illustrate metagene analysis of hypoxia, HIF1A targets, glycolysis and angiogenesis signatures. Patients ordered by decreasing overall survival (OS) following brain metastasis diagnosis. Per-patient CTCs ordered by increasing hypoxia expression. b Kaplan–Meier analysis of the OS following brain metastasis diagnosis for patients with high average hypoxia gene expression in CTCs versus those with low average hypoxia gene expression (Hallmark Hypoxia geneset). The hypoxia-high and hypoxia-low subgroups were determined on the basis of average hypoxia gene expression across all CTCs isolated for each patient. P value calculated by log rank test. c Kaplan–Meier analysis of the OS following brain metastasis diagnosis for patients with high average HIF1A target gene expression in CTCs versus those with low average HIF1A target gene expression (Transcription Factor Targets HIF1_Q5 geneset). The HIF1A targets-high and HIF1A targets-low subgroups were determined on the basis of average HIF1A target gene expression across all CTCs isolated for each patient. P value calculated by log rank test.

