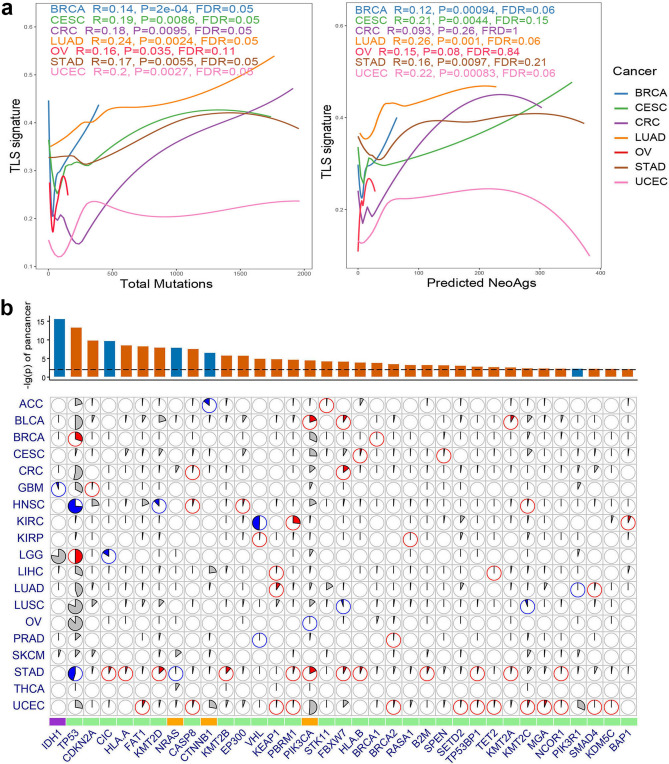
Figure 4.
Correlation of TLS scoring with mutation/neoantigen loads and driver gene mutations. (a) Local regression curves showing significant relationships of TLS scoring with total mutation count (left) and predicted neoantigen load (right) in seven tumor types; R value, p value and false discovery rate (FDR) of Spearman rank correlation analysis of each tumor type (denoted as lines in different color) were presented; curves span the 5th to 95th percentile of the mutation/neoantigen counts variable; colors correspond to tumor type and are the same in two graphs. (b) Driver gene mutations that associated with increased or decreased expression of TLS signature. Only genes showing significance (adj. P < 0.01, red for positive, blue for negative association) for non-silent mutation association with TLS scoring in pan-cancer dataset are shown in the top bar plot, with the value of y axis representing log10(p value), and the dashed line indicating threshold P = 0.01. The pie plots below demonstrated association between TLS scoring and mutation of each driver gene in different tumor types (P < 0.05, red for positive, blue for negative and gray for non-significant association). The wedges with color represent the share of samples exhibiting driver mutation.

