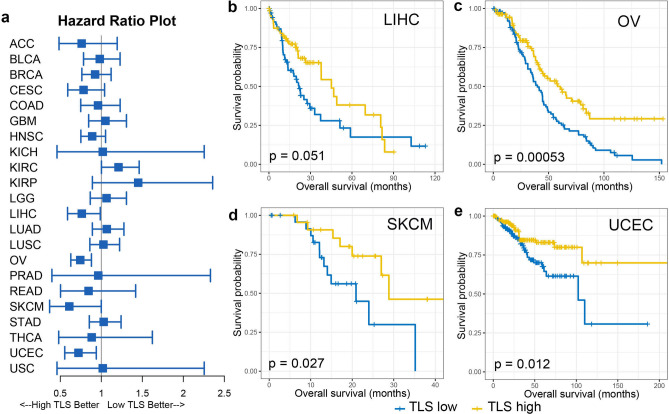
Figure 5.
High TLS score associated with improved overall survival in certain tumor types. (a) Forest plot demonstrated the survival impact of TLS level for each tumor type. Tumors were categorized into high TLS scoring (> the second tertile), intermediate TLS scoring (between the first and the second tertile) and low TLS scoring (< the first tertile) for each tumor type. Hazard Ratio (5–95% confidence interval) were obtain by cox regression survival analysis. (b) Kaplan–Meier plots of overall survival difference between tumors with high TLS scoring and low TLS scoring in LIHC. (c) Kaplan–Meier plots of overall survival difference between tumors with high TLS scoring and low TLS scoring in OV. (d) Kaplan–Meier plots of overall survival difference between tumors with high TLS scoring and low TLS scoring in SKCM. (e) Kaplan–Meier plots of overall survival difference between tumors with high TLS scoring and low TLS scoring in UCEC.

