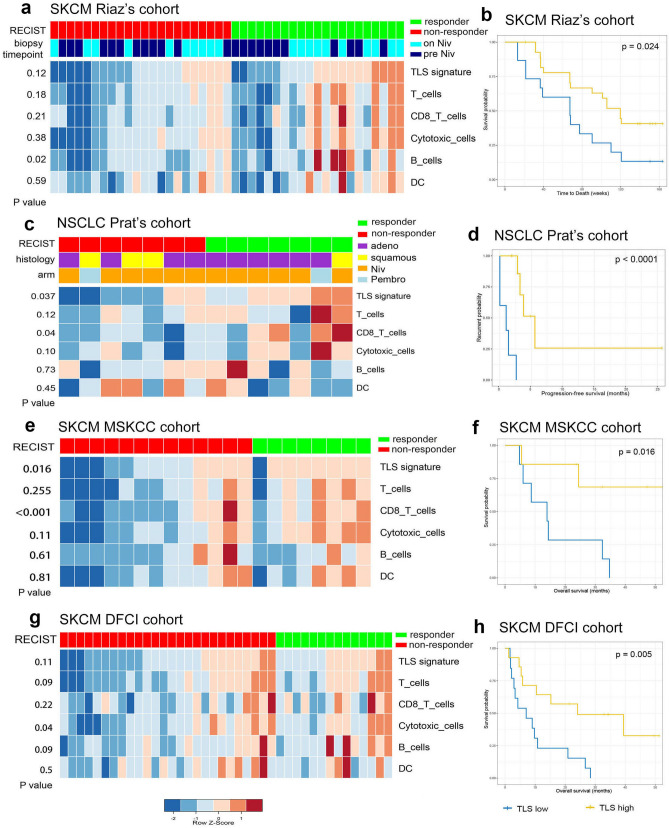
Figure 6.
Transcriptome analysis of tumor specimens from patients with advanced NSCLC or melanoma treated with anti-PD-1 blockade. (a) Supervised clustering of SKCM Riaz’s cohort by response to immunotherapy (Nivolumab) (n = 22 non-responders and 21 responders), displaying enrichment level of TLS and immune cells including T cells, CD8+ T cells, cytotoxic cells, B cells and DC. p value for the comparison between responders and non-responders were shown. The biopsy timepoint of the specimens include pre-Niv (before Nivolumab treatment) and on-Niv (during Nivolumab treatment). (c) Supervised clustering of NSCLC Prat’s cohort by response to immunotherapy (Nivolumab/Pembrolizumab) (n = 7 non-responders and 7 responders), displaying enrichment level of TLS and immune cells including T cells, CD8+ T cells, cytotoxic cells, B cells and DC. p value for the comparison between responders and non-responders were shown; Niv, Nivolumab; Pembro, Pembrolizumab; adeno, adenocarcinoma; squamous, squamous cell carcinoma. (e) and (g) supervised clustering of SKCM MSKCC cohort (n = 13 non-responders and 8 responders) and SKCM DFCI cohort (n = 26 non-responders and 14 responders) by response to anti-CTLA-4 immunotherapy (ipilimumab), displaying enrichment level of TLS and immune cells including T cells, CD8+ T cells, cytotoxic cells, B cells and DC. p value for the comparison between responders and non-responders were shown. Kaplan–Meier plots demonstrating the prognostic difference between patients with high TLS scoring (> the second tertile) and low TLS scoring (< the second tertile) in SKCM Riaz’s cohort (b), SKCM MSKCC cohort (f), SKCM DFCI cohort (h) in terms of overall survival, and in NSCLC Prat’s cohort (d) in terms of progression-free survivals.

