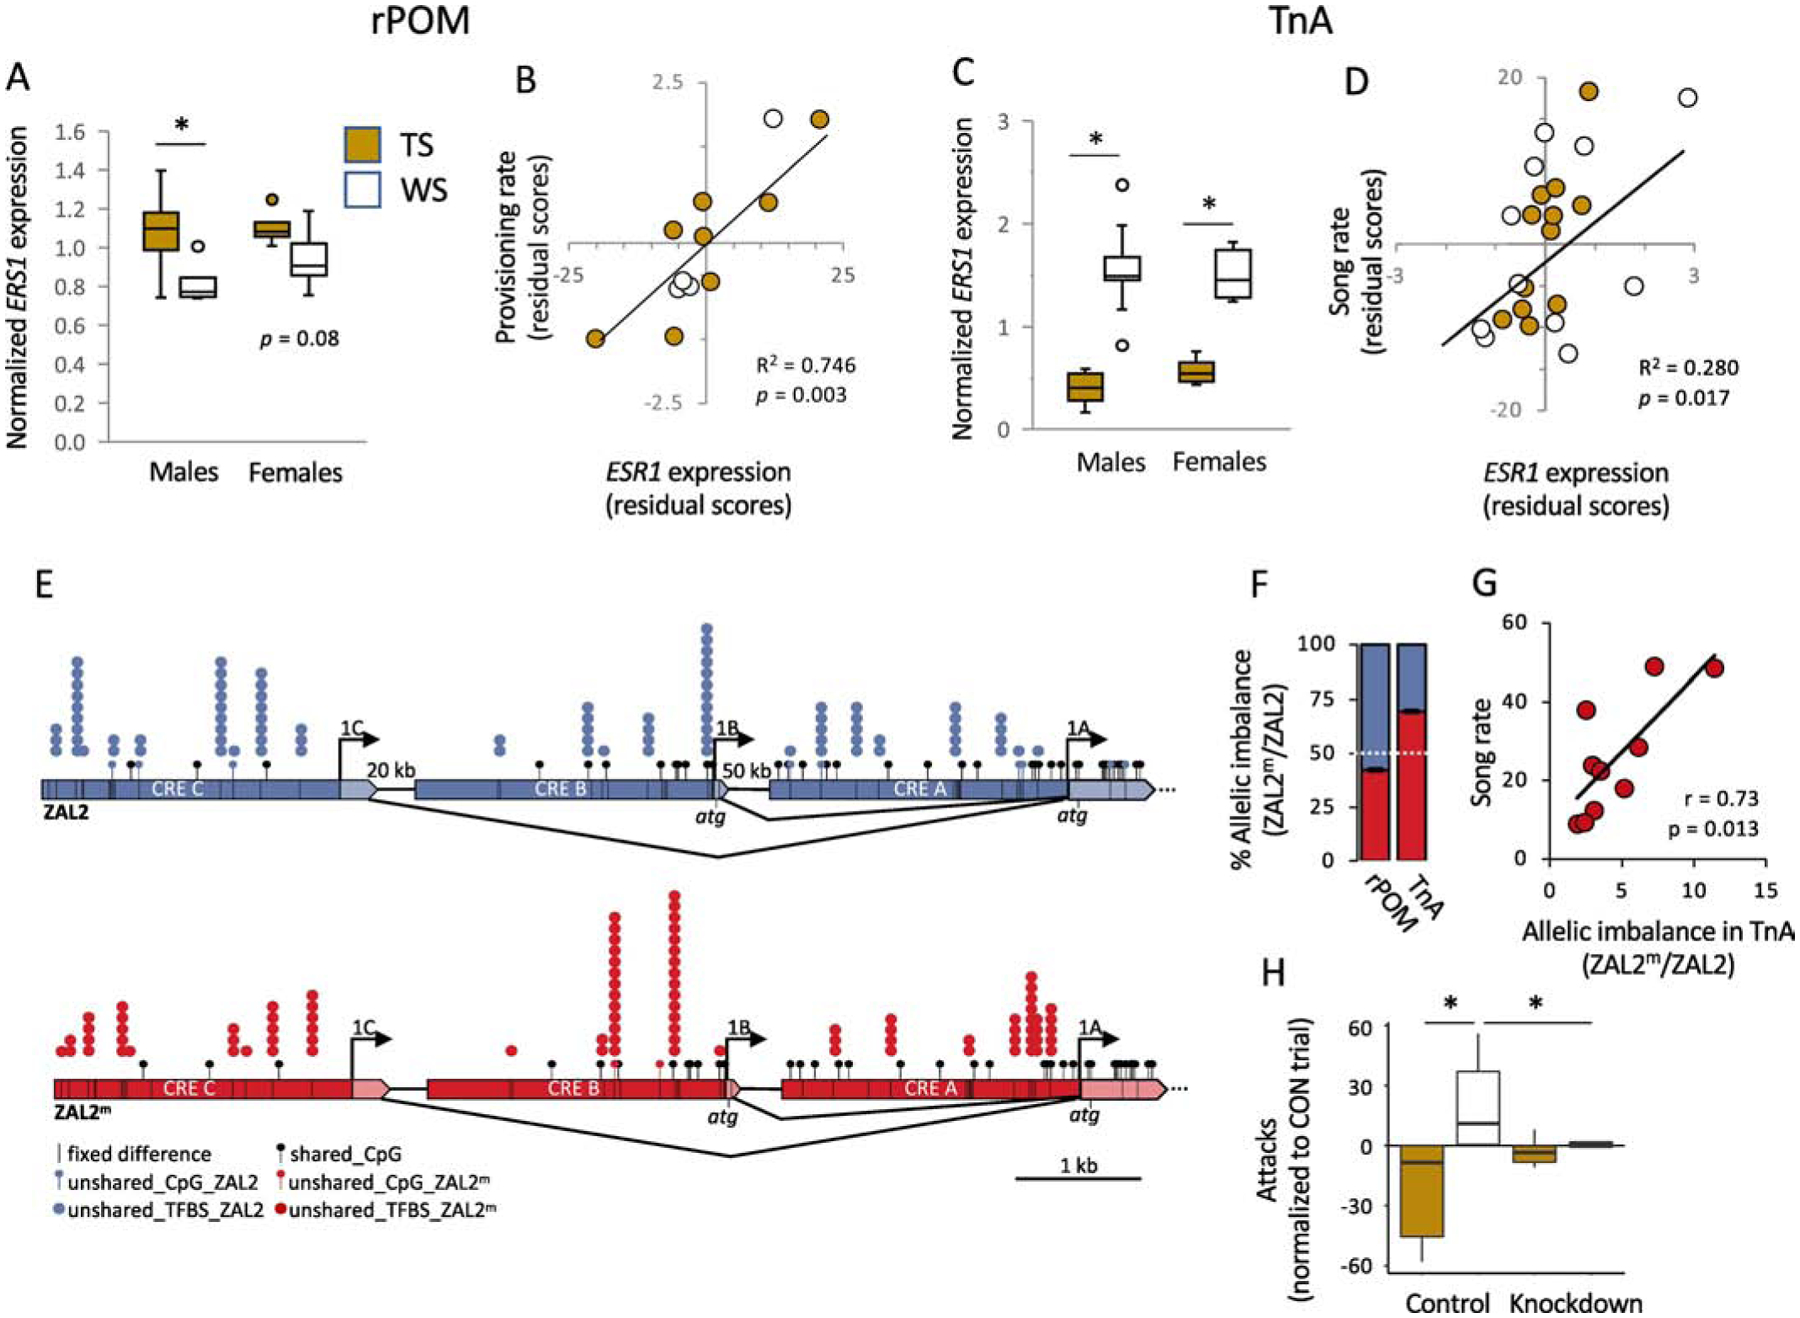
Figure 4.

Expression of ESR1 mediates morph differences in behavior in white-throated sparrows. (A) Expression of ESR1 mRNA in the rostral portion of the medial preoptic area (rPOM) differs by morph and (B) predicts parental provisioning behavior (male data are shown). Provisioning rate is the number of trips made to the nest to feed nestlings per hour on post-hatch day seven during the first nest of the season. (C) ESR1 expression in nucleus taeniae of the amygdala (TnA) differs by morph and (D) predicts the number of songs produced by males in response to a 10-min simulated territorial intrusion early in the breeding season. mRNA expression in (A – D) was measured using in situ hybridization. In (A) and (C), values are normalized to the series mean within sex. Scatterplots in (B) and (D) show residual scores after controlling for the effects of morph, plasma testosterone, and plasma estradiol (E2). (E) ESR1 is alternatively spliced. Dark blue or red regions are cis-regulatory elements (CREs); transcribed regions are light colors. Black lines within CREs represent 42 fixed differences distinguishing ZAL2 from ZAL2m. Lollipops represent CpG sites. Stacked circles represent transcription factors that are expressed in TnA and for which a binding site is disrupted by a fixed difference. (F) Allelic imbalance in rPOM and TnA of free-living heterozygous (WS) adults during the breeding season. In the bar graphs, each column represents the relative expression of ZAL2 (blue) and ZAL2m (red). The white dashed line represents a null ratio of 0.5. (G) Behavioral responses of free-living adult males to STI were predicted by the degree of allelic imbalance in TnA. (H) ESR1 knockdown eliminated the morph difference in E2-induced aggression in laboratory-housed birds. Data show the extent to which an oral dose of E2 increased attacks directed toward a conspecific, compared with baseline. * p < 0.05. Data are replotted from Horton et al. (2014b) and Merritt et al. (2020).
