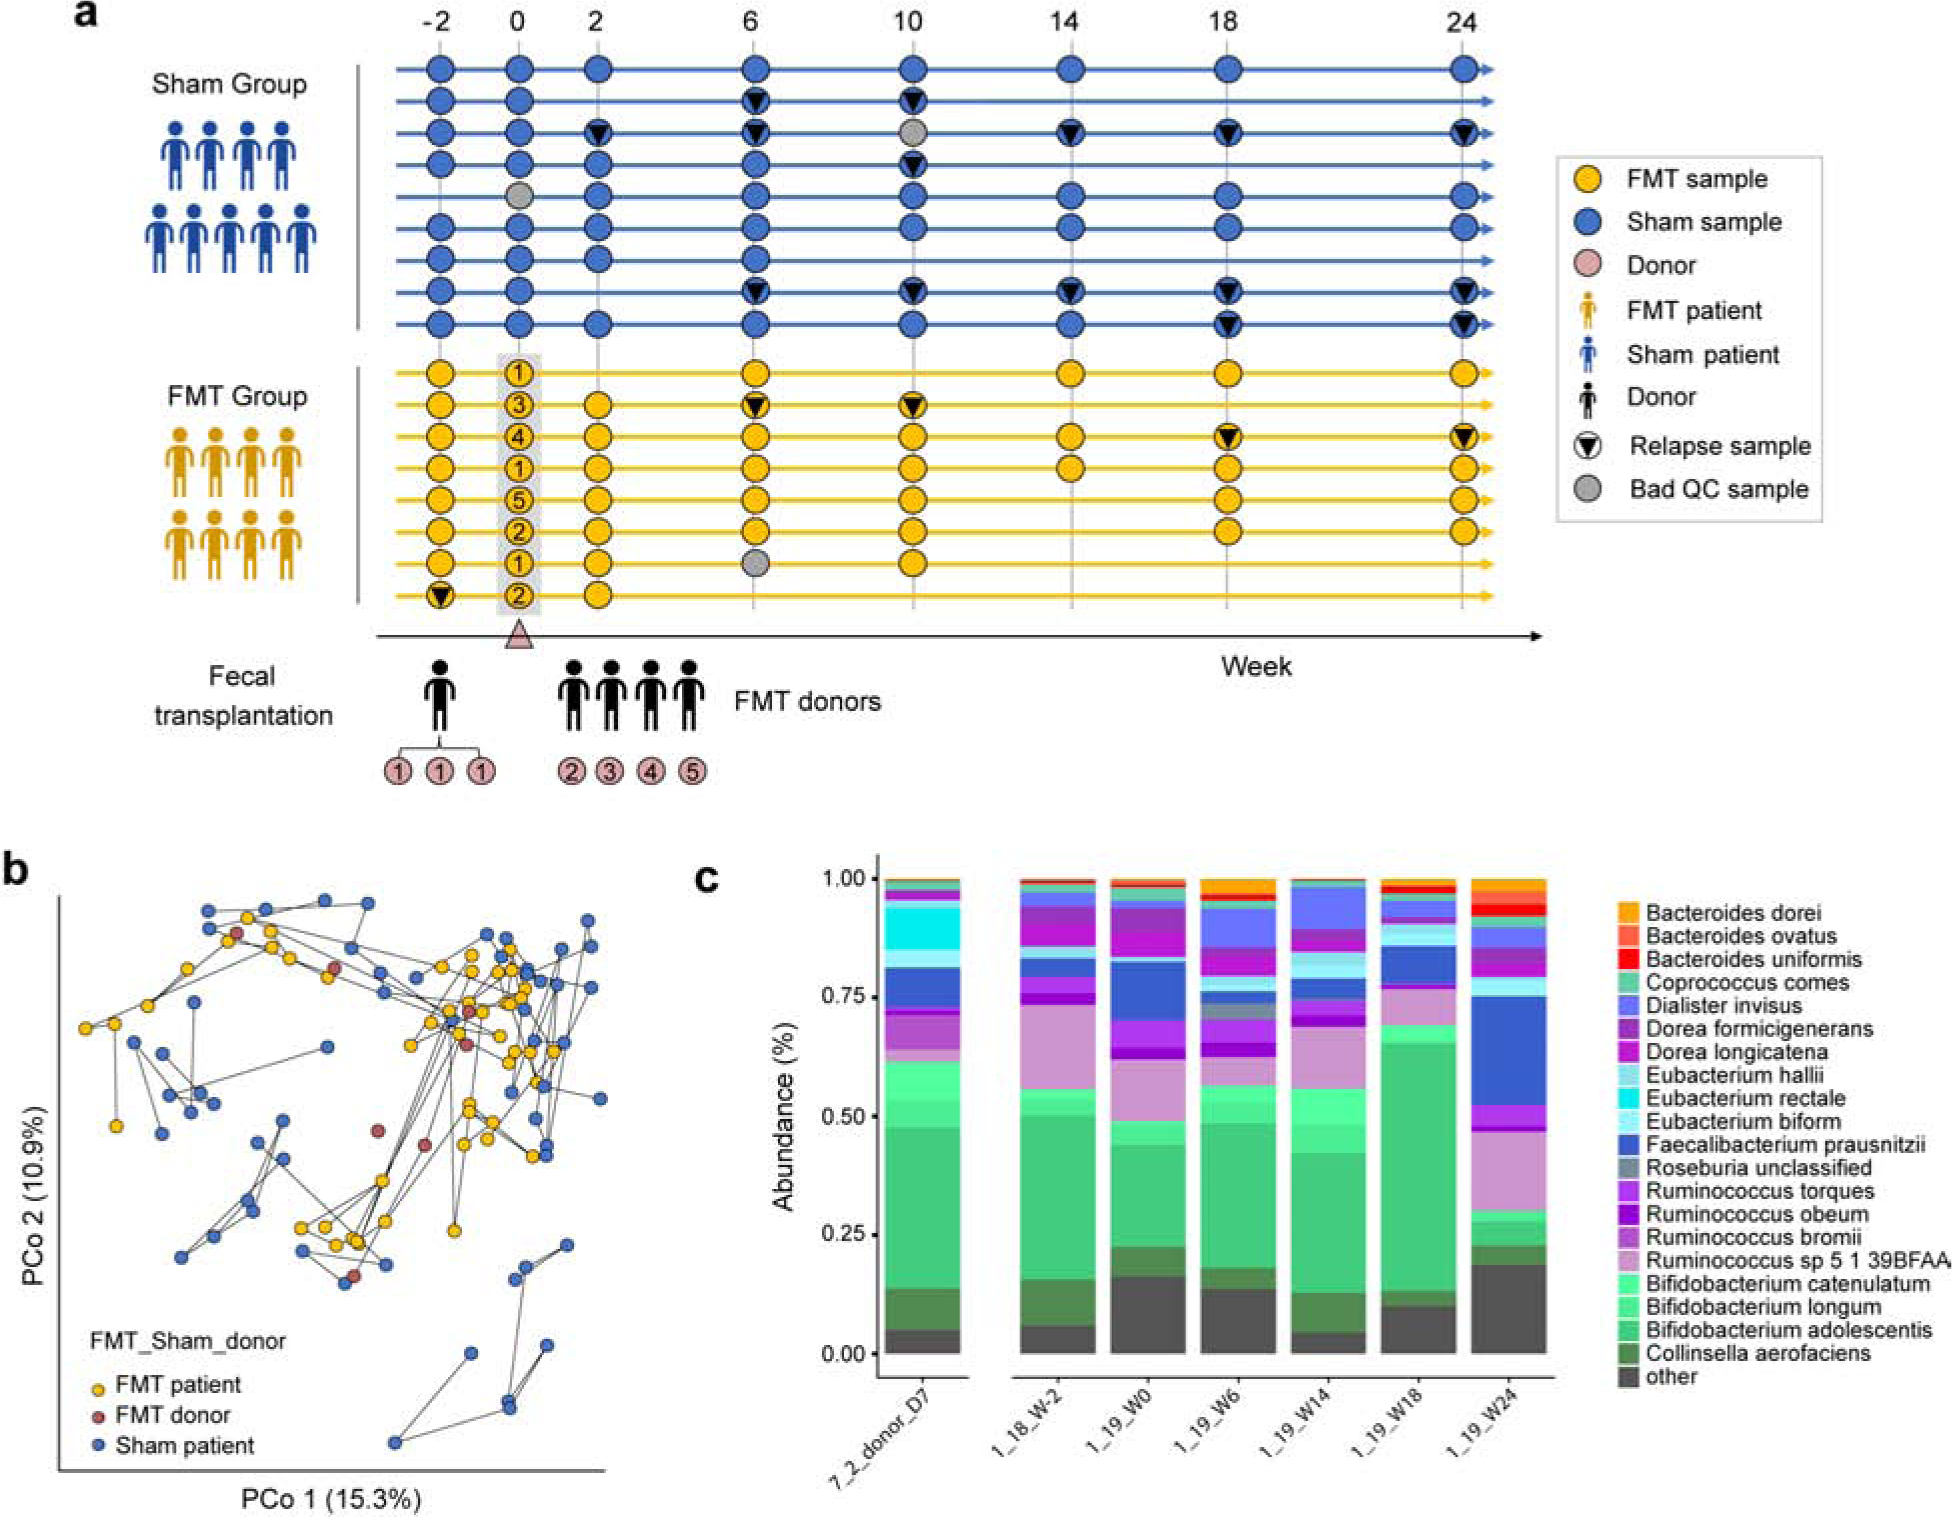
Figure 1. FMT study design.

(a) 115 samples were collected from 9 sham patients (blue), 8 FMT patients (yellow), and 5 donors (numbered 1–5, light brown) over 24 weeks. Relapse (black triangles), and samples that failed QC (grey dots) are also marked. At week 0, FMT patients received fecal transplantation and sham patients received sham transplantation19. (b) Principal coordinates analysis of Bray-Curtis dissimilarities from species-level MetaPhlAn2 profiles. Lines connect samples from the same patient/donor. Separate samples were obtained at different times for the donor with 3 patients (7_2). (c) Barplot of species abundances over time in one FMT patient (1_19) and their donor (7_2_D7).
