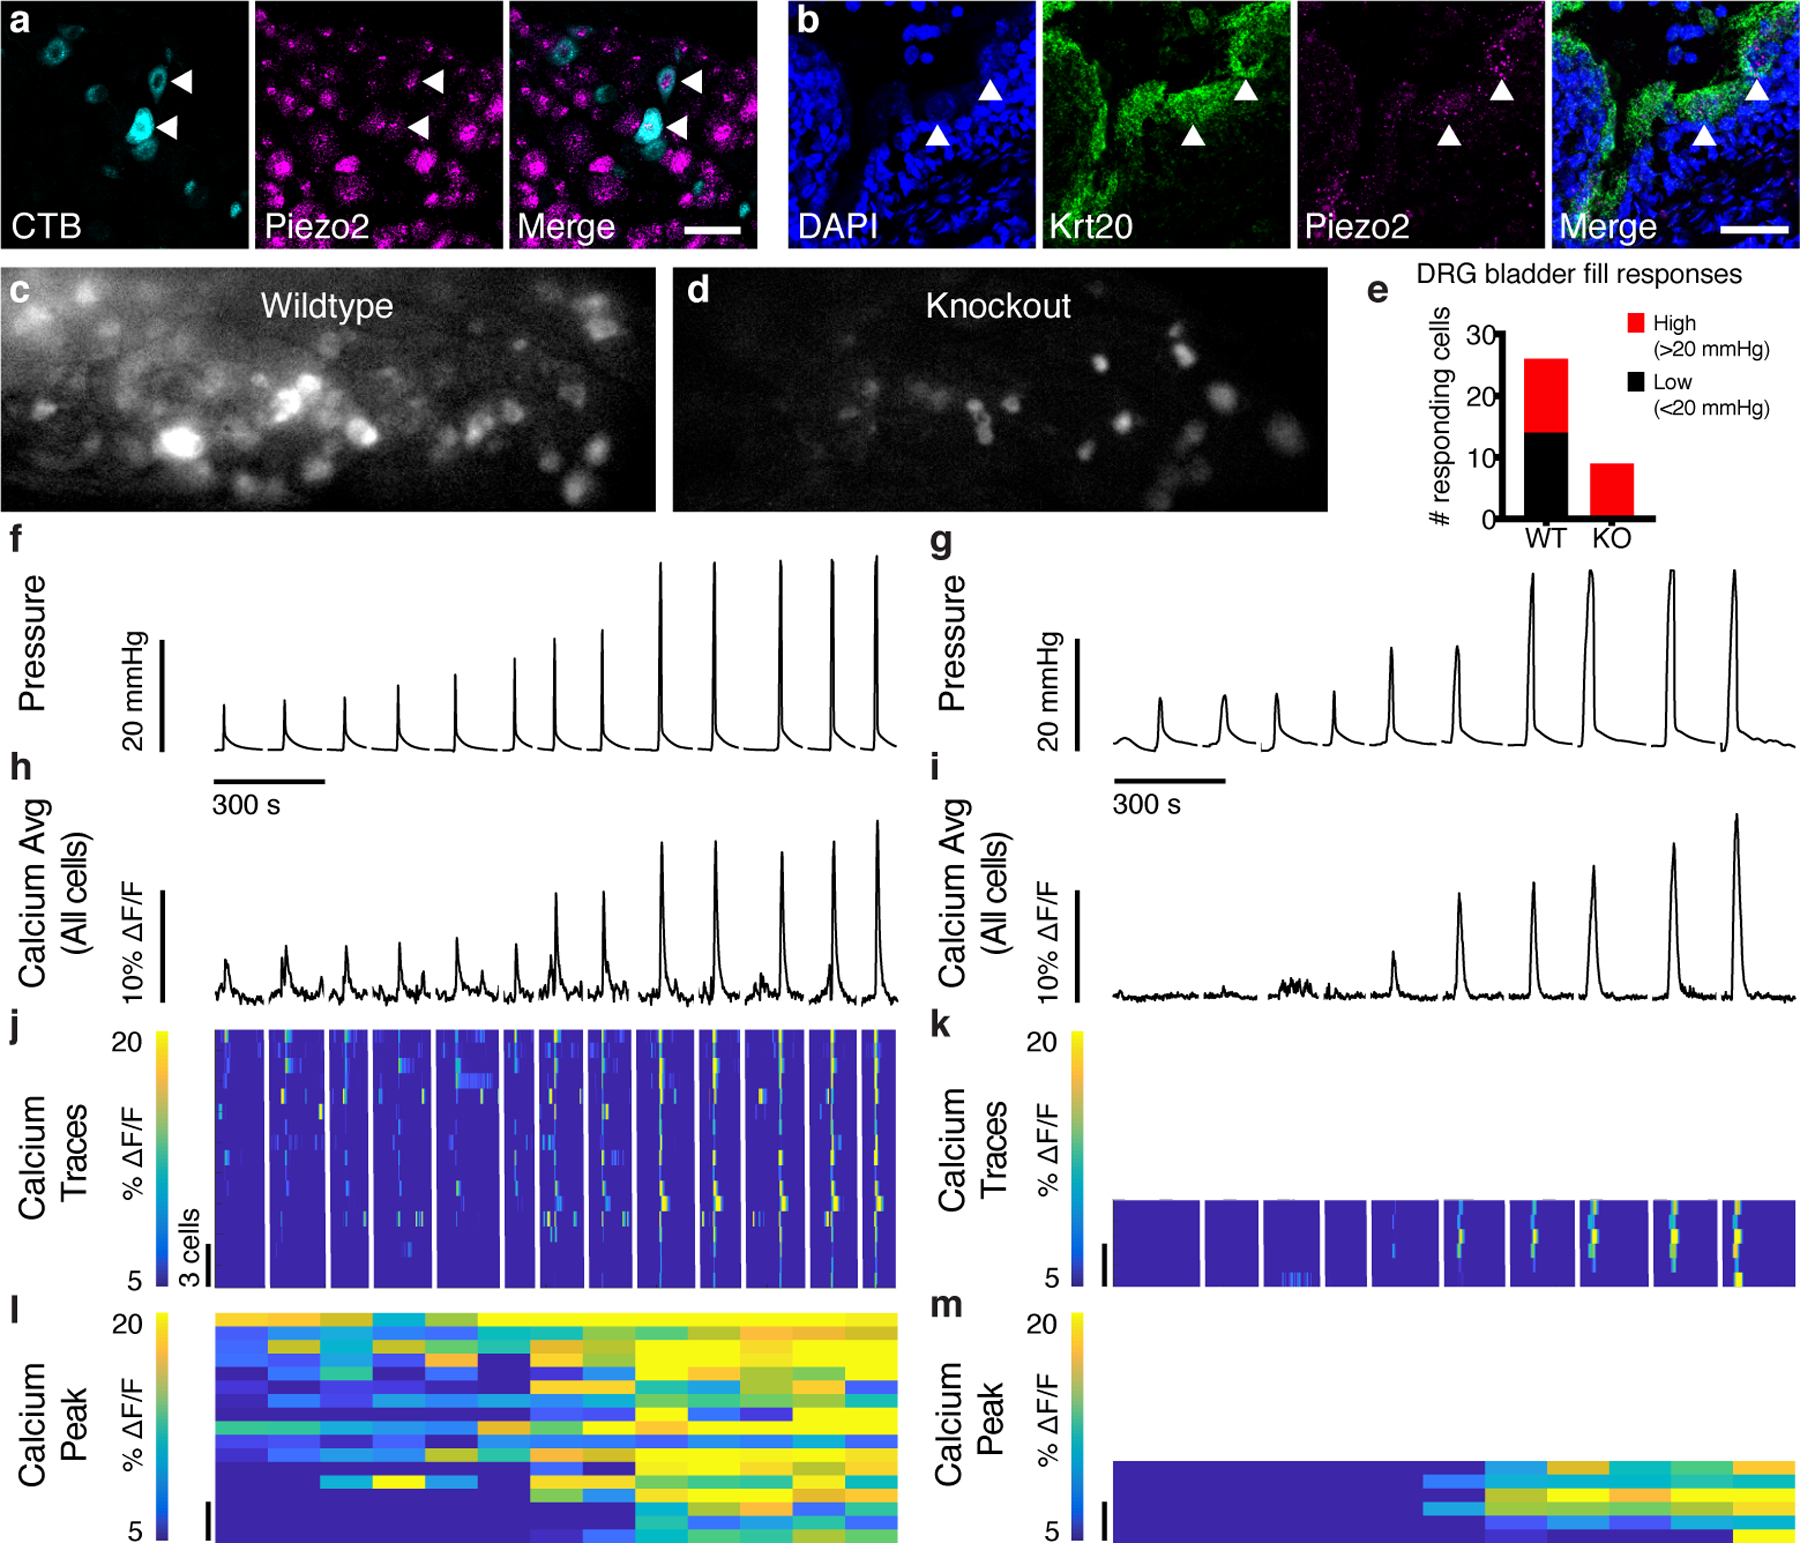
Figure 2. The lower urinary tract expresses Piezo2, and sensory neurons require PIEZO2 for detecting low-pressure bladder filling.

a, DRG neurons were retrogradely labeled using CTB-488. (cyan, left) fluorescent in situ hybridization (FISH) of DRGs with probes targeting Piezo2 (magenta, middle). Arrowheads point to Piezo2+ bladder neurons. Scale: 50 μm. Tracing experiment was repeated using three mice, N=22–36 cells analyzed per animal. b, FISH of bladder, probes against Krt20 (green) and Piezo2 (magenta). DAPI in blue. Arrowheads point to Piezo2+ umbrella cell examples. Scale: 50 μm. RNAscope was performed on three bladders, with two technical replications. Analysis was performed on 80–117 nuclei per bladder. c, Image z-stack from GCaMP6f+/+ control mouse S1 DRG during bladder fill. d, Example image from Piezo2cKO mouse S1 DRG during bladder fill. e, Count of cells responding to low- (black) and high-pressure (red) stimuli in WT (N=3 animals) and KO (N=4 animals) DRG. f, Example pressure trace from a wildtype DRG and g, knockout DRG. Stimuli were interleaved during recording, but are shown sorted low to high, hence the discontinuous line. Data below these graphs is sorted together with the respective pressure peaks. h, i, Average percent change in calcium fluorescence for all responding cells during the pressure peaks shown above in f and g, respectively. j, Calcium traces for individual wildtype cells that responded to pressure stimuli in f (N=17). Scale for cell number applies to j-m. k, Calcium traces from all knockout cells responding to pressure stimuli shown in g (N=6). Each cell’s responses are shown on the same horizontal line. Cells are sorted by cumulative response to the four lowest-pressure stimuli. l, m, Maximum calcium response for the cells shown above, 1 s after pressure peak.
