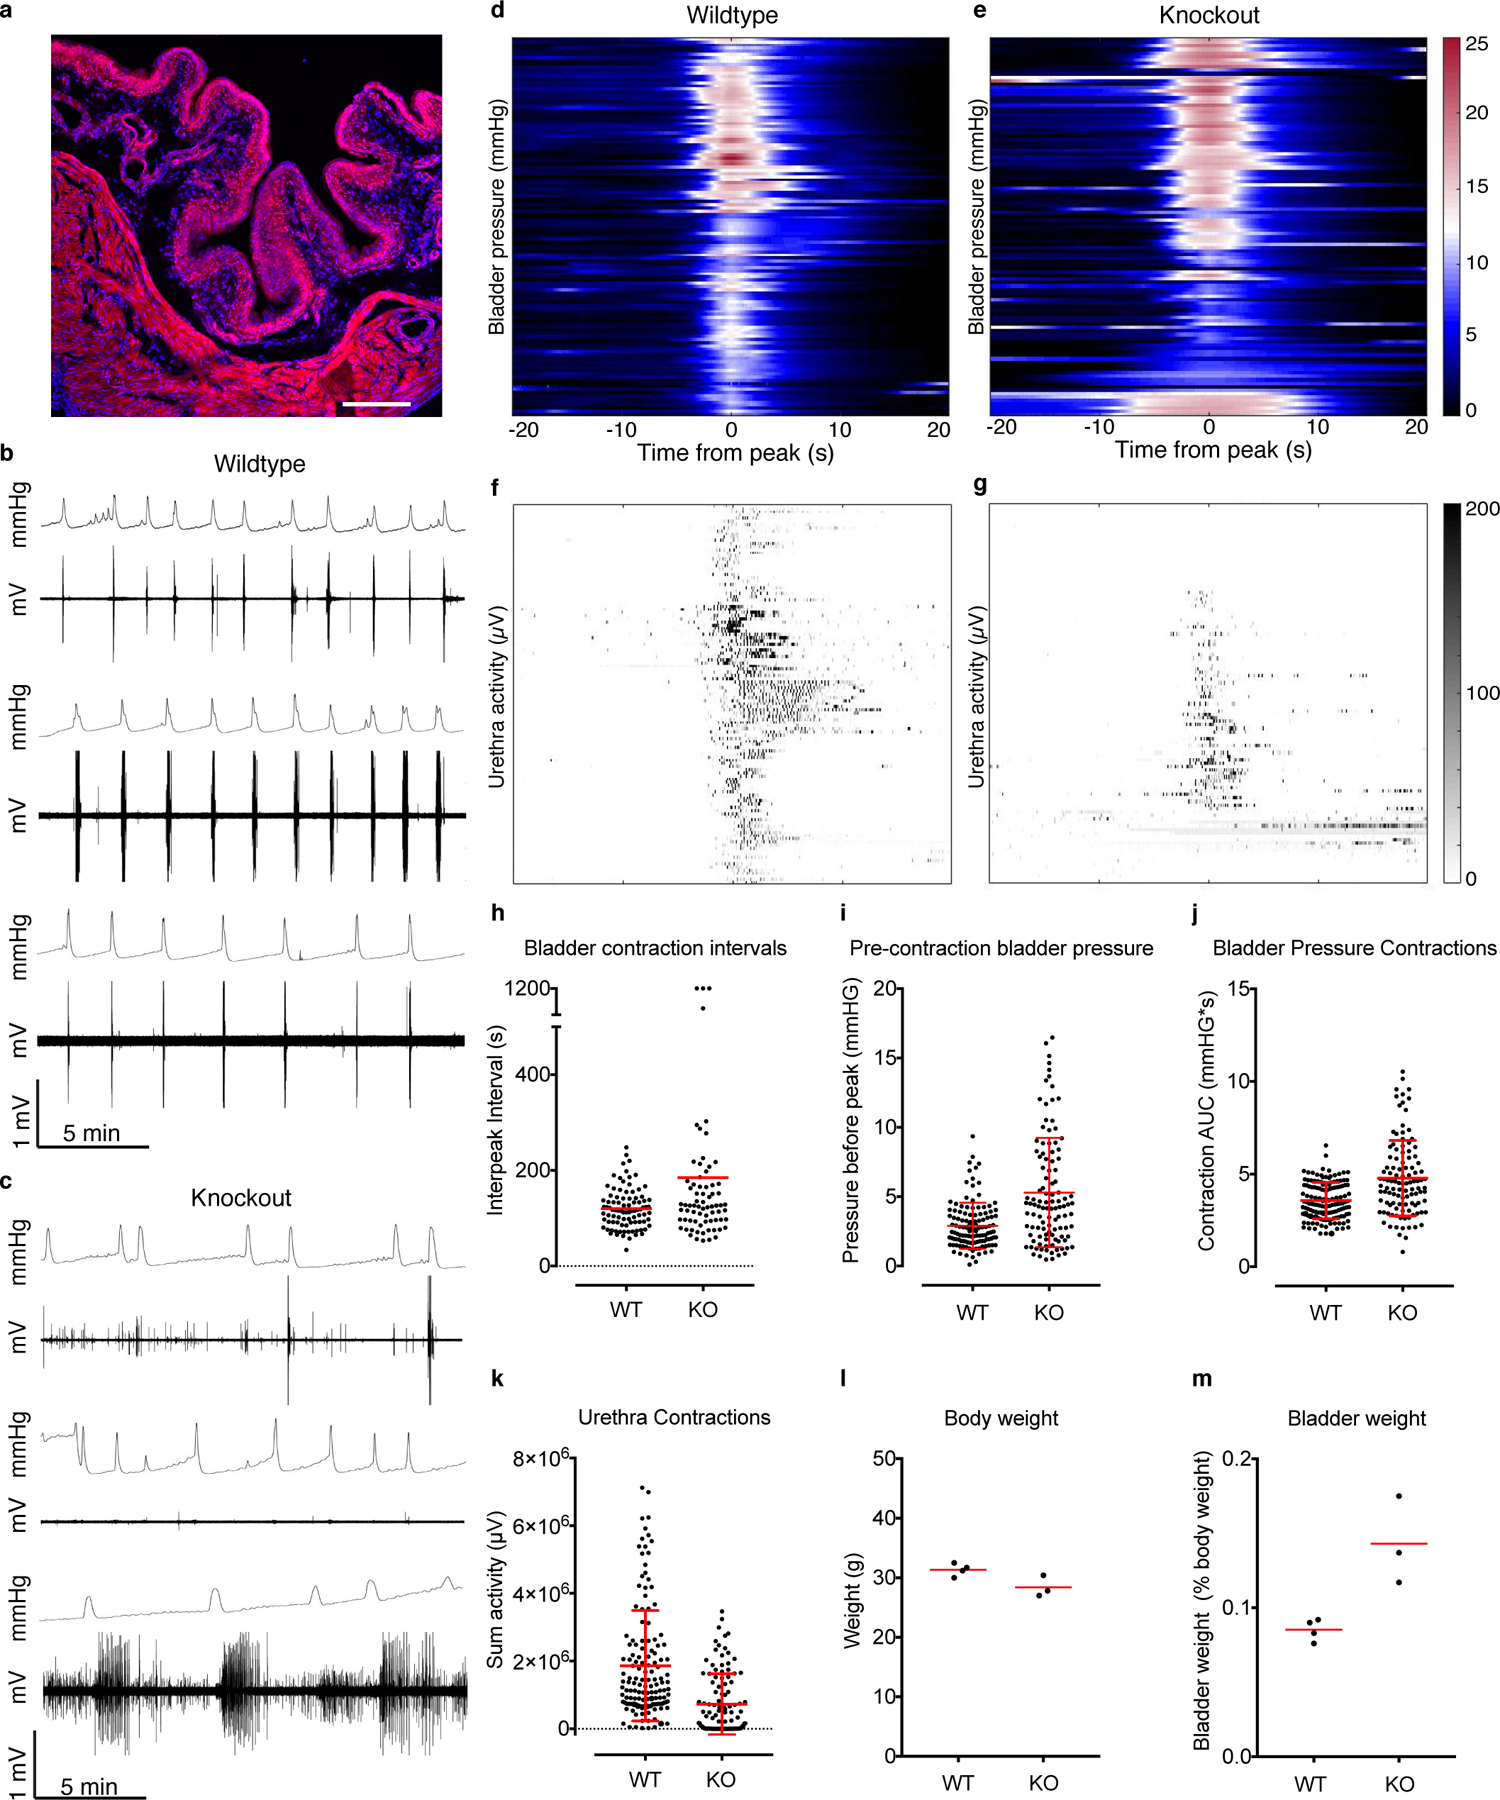
Extended Data Figure 2.

a, HoxB8Cre;Ai9 bladder tissue, fixed, frozen and mounted to show tdTomato (red) throughout the tissue, labeled with DAPI (blue). Scale is 100 μm. Expression was evaluated in two mice. b, Example pressure and urethra activity traces from three wildtype males and c, three HoxB8Cre;Piezo2f/f knockout male littermates. d, heatmap of individual bladder contraction events in wildtype and e, knockout male mice, with corresponding urethra activity below in f and g respectively. h, Bladder contraction intervals for males. i, bladder pressures five seconds before peak contraction for males. Note: 1200 s was the length of one recording. These dots represent recording periods where the animal had no successful urination events. j, Total bladder pressure for males and k, sum of urethra activity during bladder contractions. N = 6 males per group. P<0.0001 for graphs in h, i, j and k, two-sided Student’s t test with Welch’s correction. l, body weights from a subset of mice whose bladder weights are shown in Figure 2t, and m, bladder weights from animals in l, shown as a percentage of body weight. Red horizontal lines indicate means, vertical red bars indicate +/− standard deviation (shown where possible).
