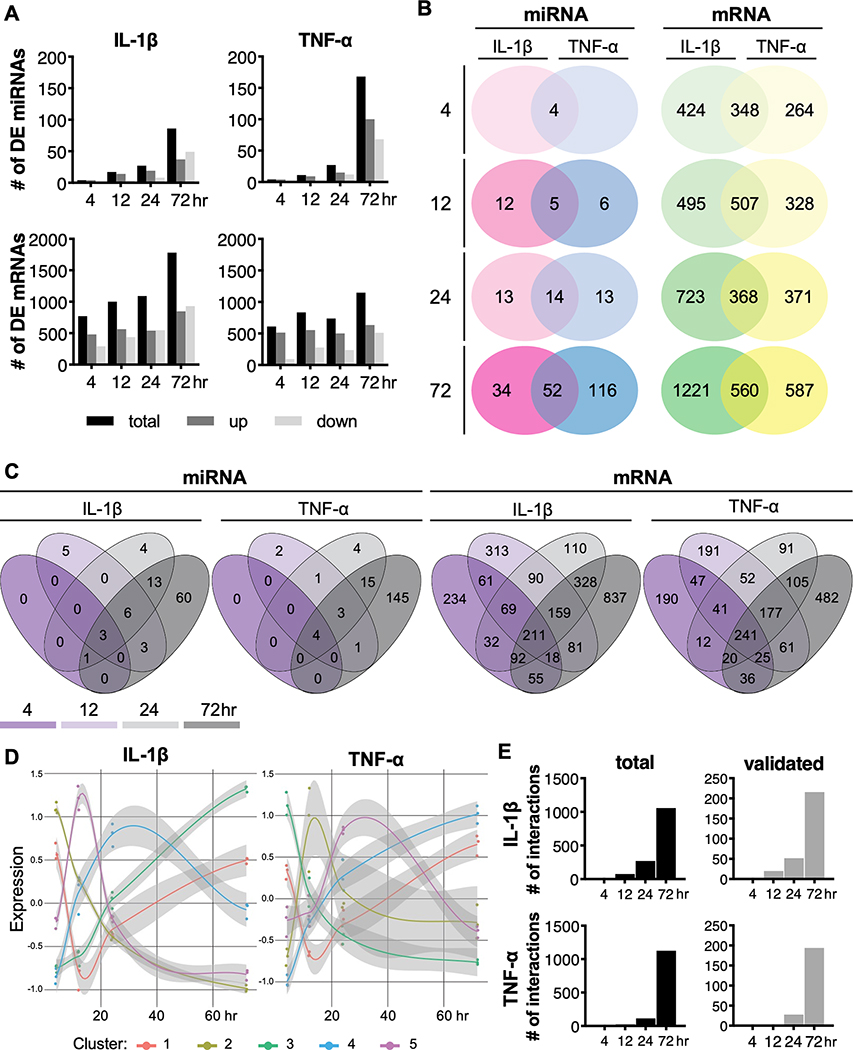
Figure 2.
Differential expression (DE) analysis of miRNAs and mRNAs. (A) The number of up- and down-regulated miRNAs and mRNAs in response to IL-1β or TNF-α over time. Distribution of shared or unique miRNAs or mRNAs (B) with each inflammatory cytokine over time or (C) at each time point. (D) Expression patterns of clusters of differentially expressed miRNAs. Points on graph represent the scaled reads per kilobase per million mapped reads (RPKM) values for the centers of each sample in the cluster (n=3). (E) The number of total and validated miRNA-mRNA interactions for IL-1β and TNF-α following RNA- and small RNA-sequencing data integration.

