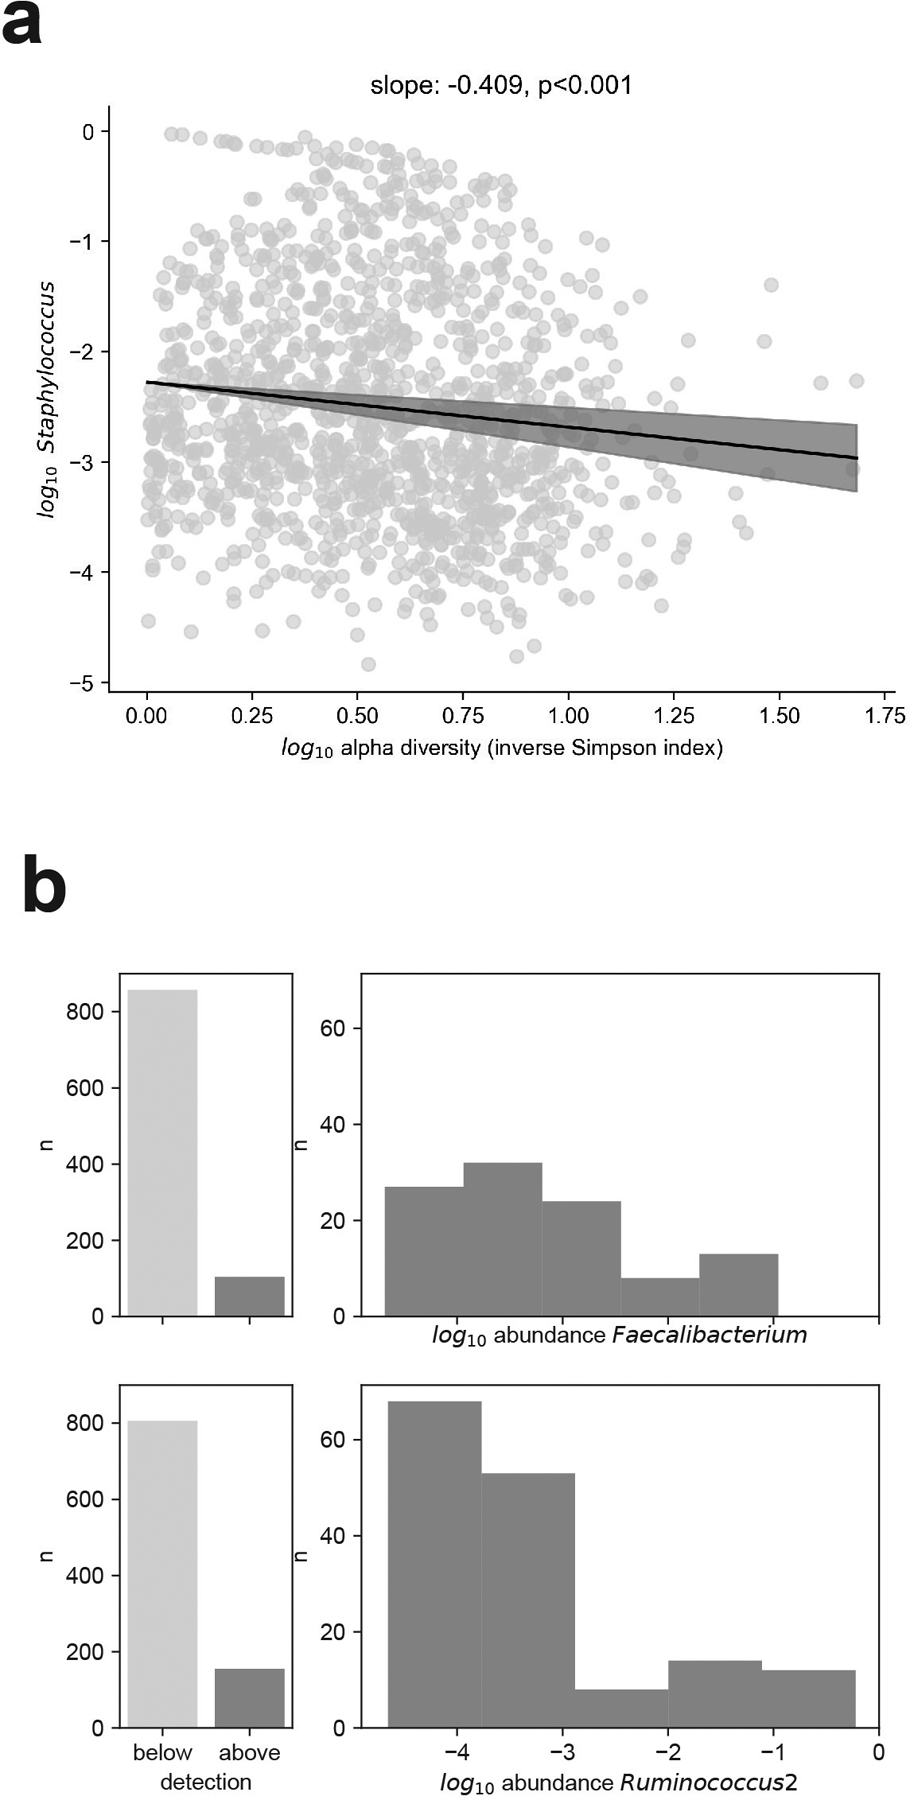
Extended Data Fig. 9: Abundance profiles of bacterial genera across analyzed samples.

a, The relative non-zero abundance of Staphylococcus is inversely related to microbiome alpha diversity, bold line: regression line from a linear model of the mean of the log10 Staphylococcus relative abundance, shaded: 95% confidence intervals (n=1,381 samples with non-zero Staphylococcus abundances). b, c, Abundance profiles of the two genera, Faecalibacterium (b) and Ruminococcus 2 (c), most strongly associated with white blood cell increase; number of times detected (left) and log10 abundance distribution when above detection (right).
