
Extended Data Fig. 2: FMT increases WBC counts.
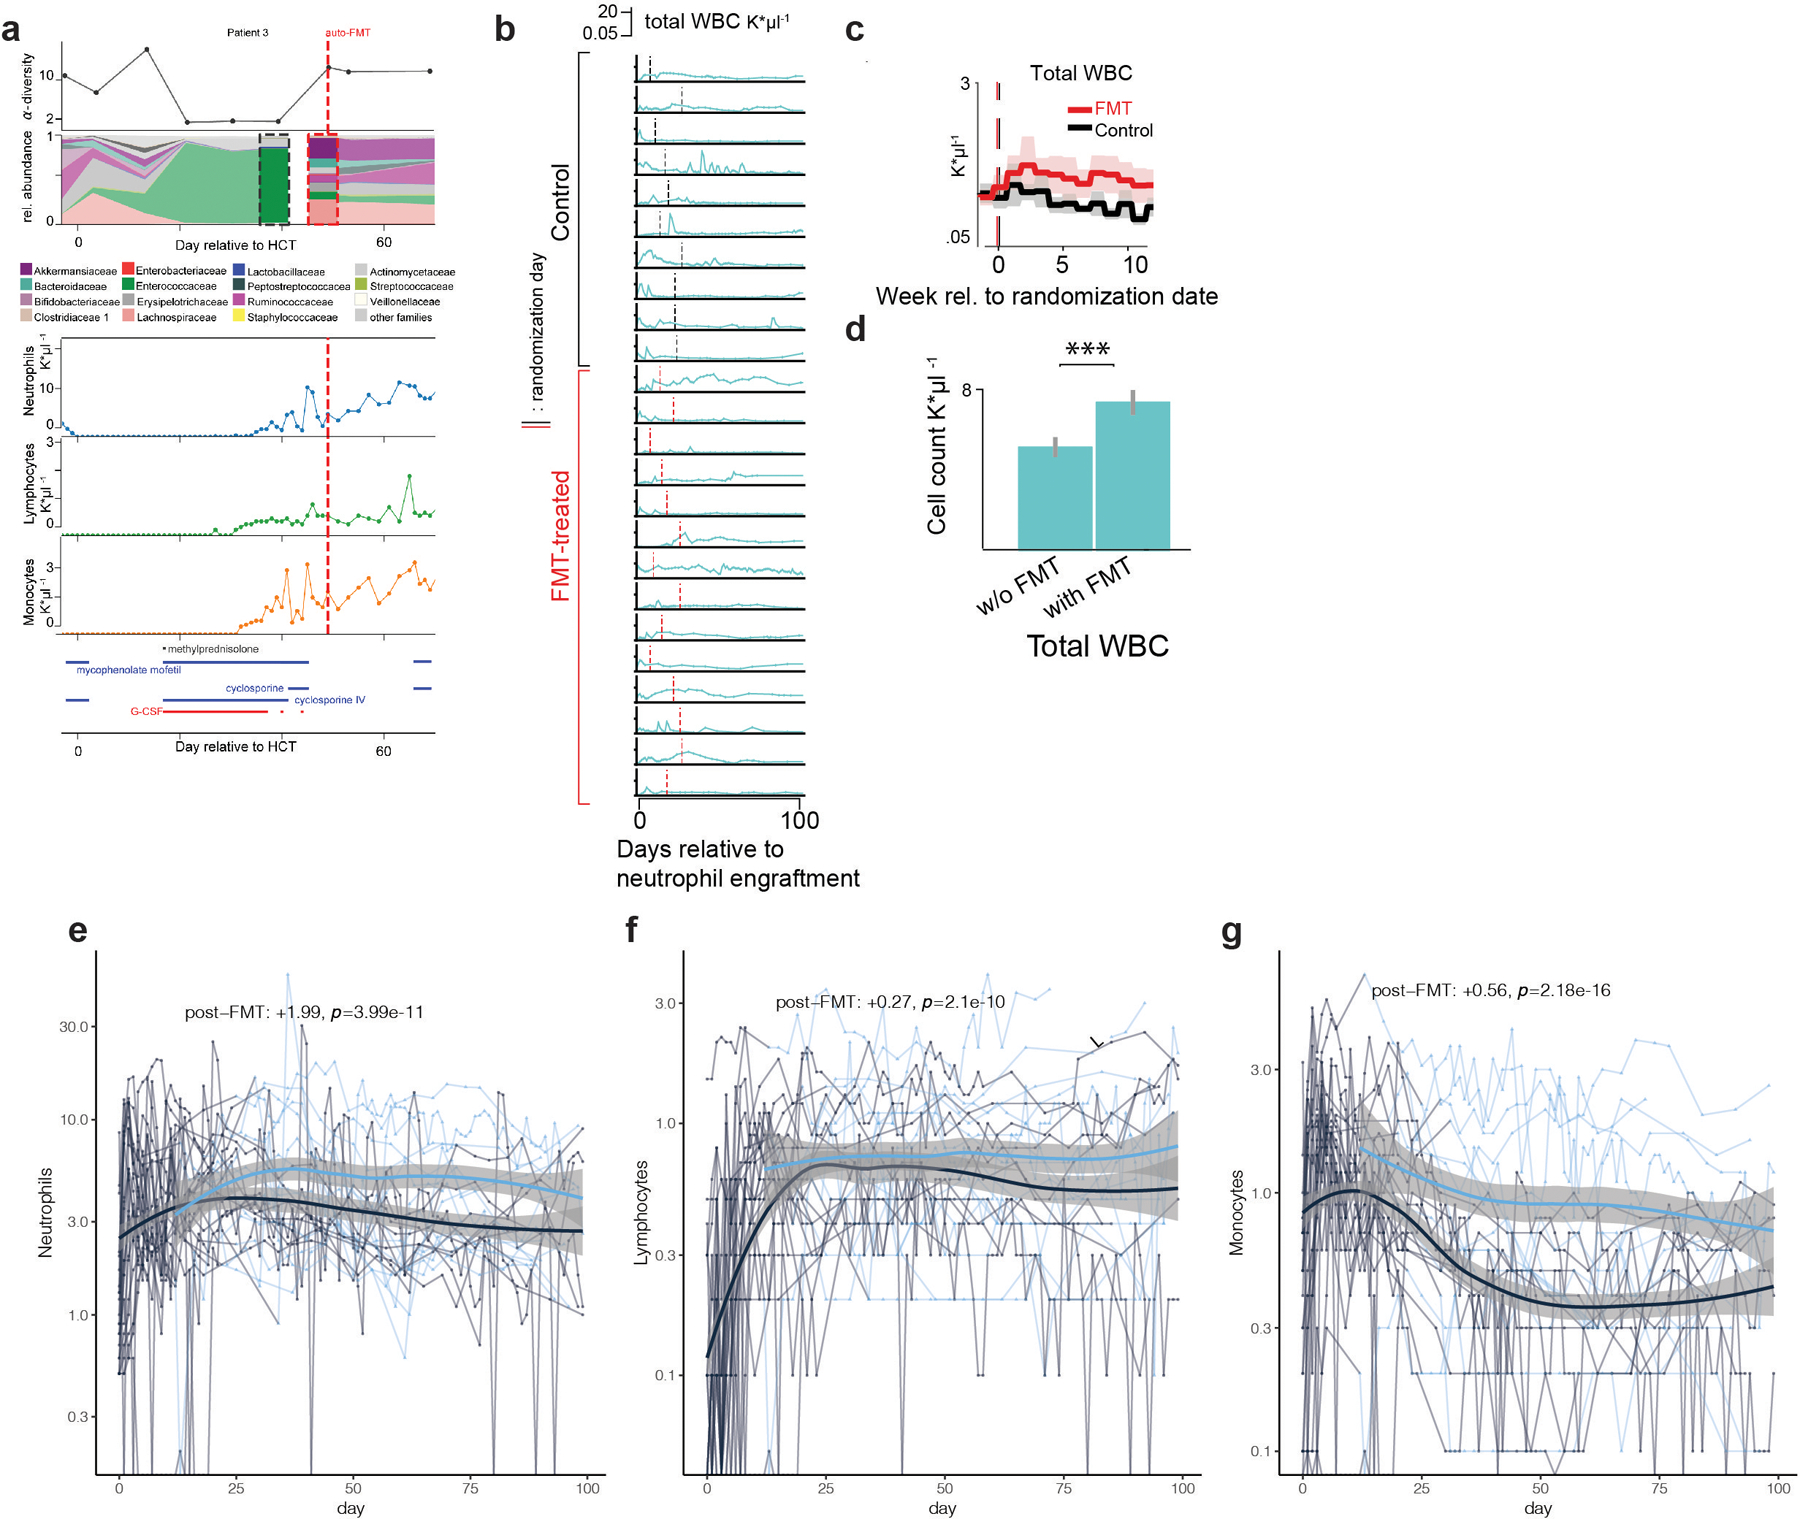
a, HCT patient who received an autologous fecal microbiota transplant (auto-FMT, dashed red line) that restored commensal microbial families and ecological diversity in the gut microbiota, with concurrent cell counts of peripheral neutrophils, lymphocytes and monocytes and immunomodulatory drug administrations. b, total white blood cell counts in 24 enrolled patients (10 control, 14 treated) post-neutrophil engraftment; vertical lines indicate randomization dates. c, weekly mean WBC counts aligned to the randomization date (FMT-treated: red, control: black). Line: mean per week, shaded region: 95%-CI. d, coefficient estimates (mean vs. mean + FMT effect) from linear mixed effects models of total WBC counts over time indicate an auto-FMT-induced increase of WBCs (βFMT: p=7×10–14). e, f, g, respectively: neutrophil, lymphocyte and monocyte count trajectories of 24 FMT trial patients. Thin lines: raw data (blue: post-FMT); thick black: mean per day, thick blue: mean+post-FMT coefficient. Means and confidence intervals (shaded region) without (black) and after FMT (blue), as well as the coefficient estimate for FMT treatment and its p-value from a linear mixed effects model relating cell counts over time to the FMT treatment (methods).