
Extended Data Fig. 4: Additional coefficients, posterior convergence evaluation and validation.
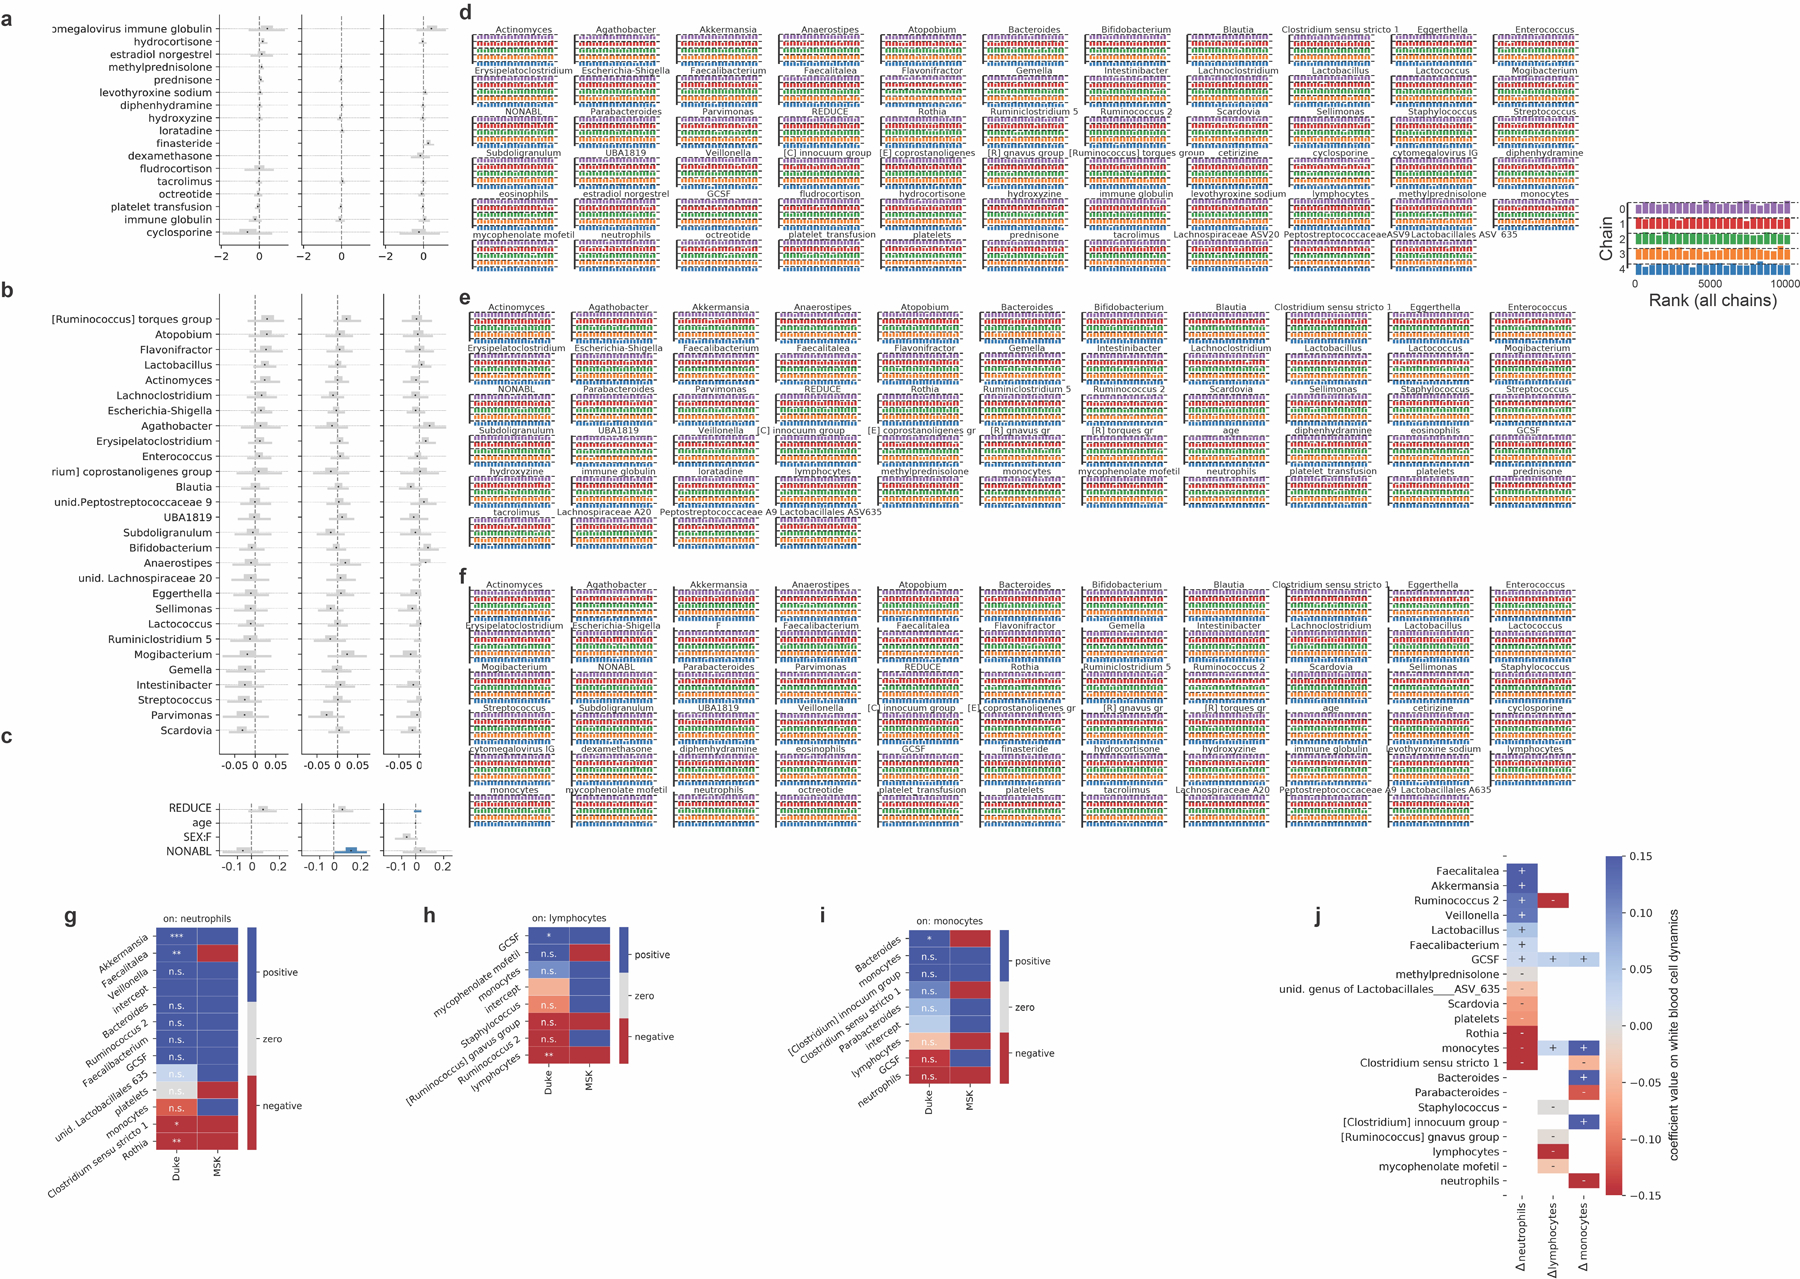
a-c, Additional posterior coefficient estimates of medications, additional genera and HCT metadata from the Bayesian stage 2 regression, see also Fig. 3. REDUCE: reduced-intensity conditioning regimen; NONABL: non-myeloablative conditioning regimen. F: female. d-f, posterior sampling convergence. Histograms of the ranked posterior draws from the model of neutrophil, lymphocyte and monocyte dynamics, respectively, in PBSC patients (ranked over all chains), plotted separately for each chain show no substantial differences between chains. g-i, Predictors of white blood cell dynamics using data from patients treated at Duke. Heatmaps indicate the slope coefficients from individual univariate regressions of microbiome and clinical predictors with changes in neutrophils, lymphocytes and monocyte, and for comparison the corresponding coefficients signs from the Bayesian multiple linear regressions in stage 2 of the analysis of white blood cell dynamics in MSK patients (Fig. 3). P-values were adjusted for multiple hypothesis testing using Bonferroni correction: ***<0.001, **<0.01, *<0.05; p>0.05: n.s. Sign of coefficients from MSK PBSC patients for comparison. j, equivalent validation analysis from patients treated at Duke using partial least squares regression of microbiome and clinical predictors identified in stage 2 of our analysis on daily changes in neutrophils, lymphocytes and monocyte.