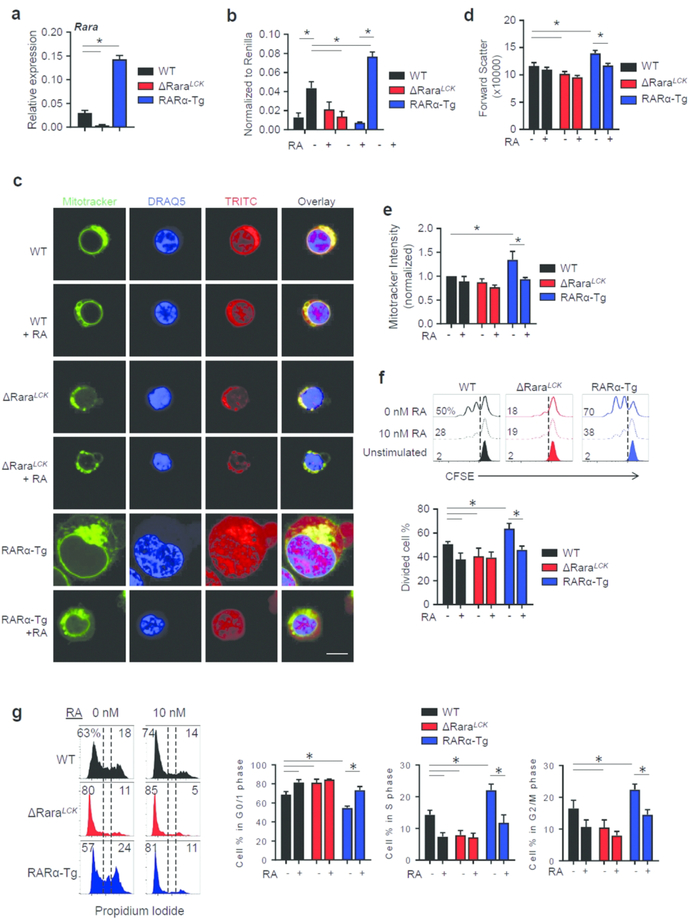
Fig. 1. The dose effect of RARα on cell size, proliferation, and mitochondrial mass.
(a) Expression levels of full length RARα mRNA in naïve CD4+ T cells isolated from the spleen of WT, ΔRaraLCK, and RARα-Tg mice. (b) RARE-reporter activity in WT, ΔRaraLCK, and RARα-Tg T helper cells. (c) Cell size, morphology, and mitochondrial staining at 24 h during activation. Scale bar is 5 μm. (d) Cell size of WT, ΔRaraLCK, and RARα-Tg CD4 T cells, based on forward scatter characteristics at 24 h during activation. (e) Mitotracker staining for mitochondrial content in CD4+ T cells. (f) Cell proliferation as measured by CFSE dilution at 48 h during activation. (g) Cell cycle analysis based on PI staining at 48 h of activation. (c-g) Naïve CD4+ T cells were cultured in a Th17-polarization condition (mIL-6, mIL-1ß, mIL-21, mIL-23, mTNFα, hTGFβ−1, anti-IFNγ, and anti-IL-4) for indicated periods. Representative and combined data (n=6 for a; n=3 for b-f; n=4 for g) are shown. All error bars indicate SEM. *Significant differences (P values <0.05) between indicated groups by repeated-measures two-way ANOVA with Bonferroni. For panel a, one-way ANOVA with Bonferroni was used.

