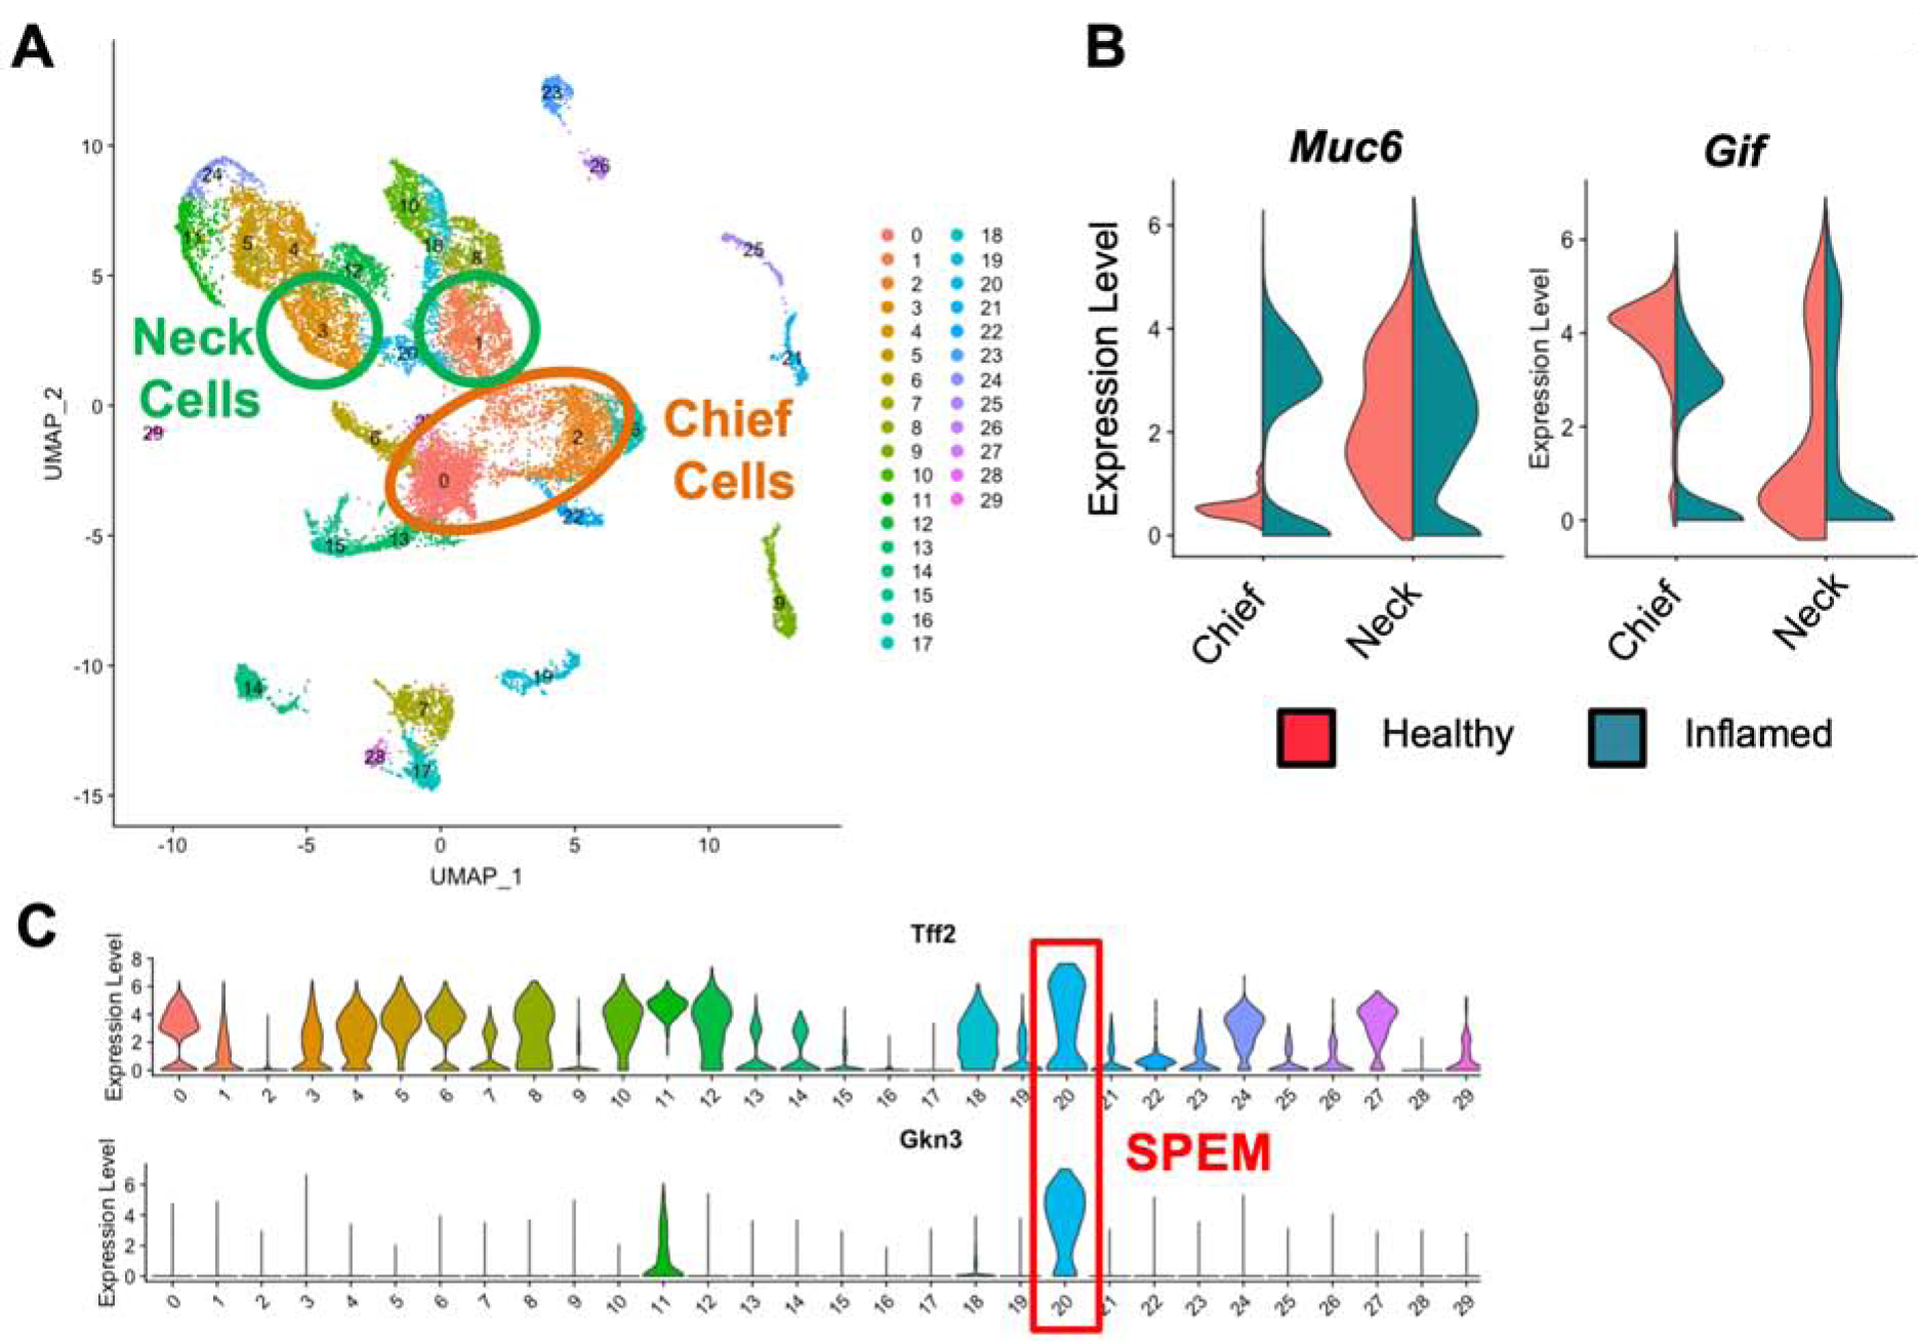
Figure 1. Identification of mucous neck cells, chief cells, and SPEM cells in single cell transcriptional data sets.

(A) Uniform manifold approximation and projection (UMAP) based unbiased clustering of gastric epithelial cell suspensions isolated from healthy BALB/c and chronically inflamed TxA23 mice. Cells are colored by cluster identity. Clusters corresponding to mucous neck cells are circled in green and clusters corresponding to chief cells are circled in orange. (B) Violin plots of mucous neck cell and chief lineage specific gene expression within the mucous neck and chief cell clusters identified in Figure 1A. Violin plots are divided in half by the library the cell was identified in, left side showing gene expression in healthy BALB/c cells (red), right side showing gene expression in chronically inflamed cells (green). (C) Violin plots of Tff2 and Gkn3 gene expression levels in all identified clusters of the combined healthy and inflamed scRNA-seq libraries. The cluster identified as SPEM is outlined in red.
