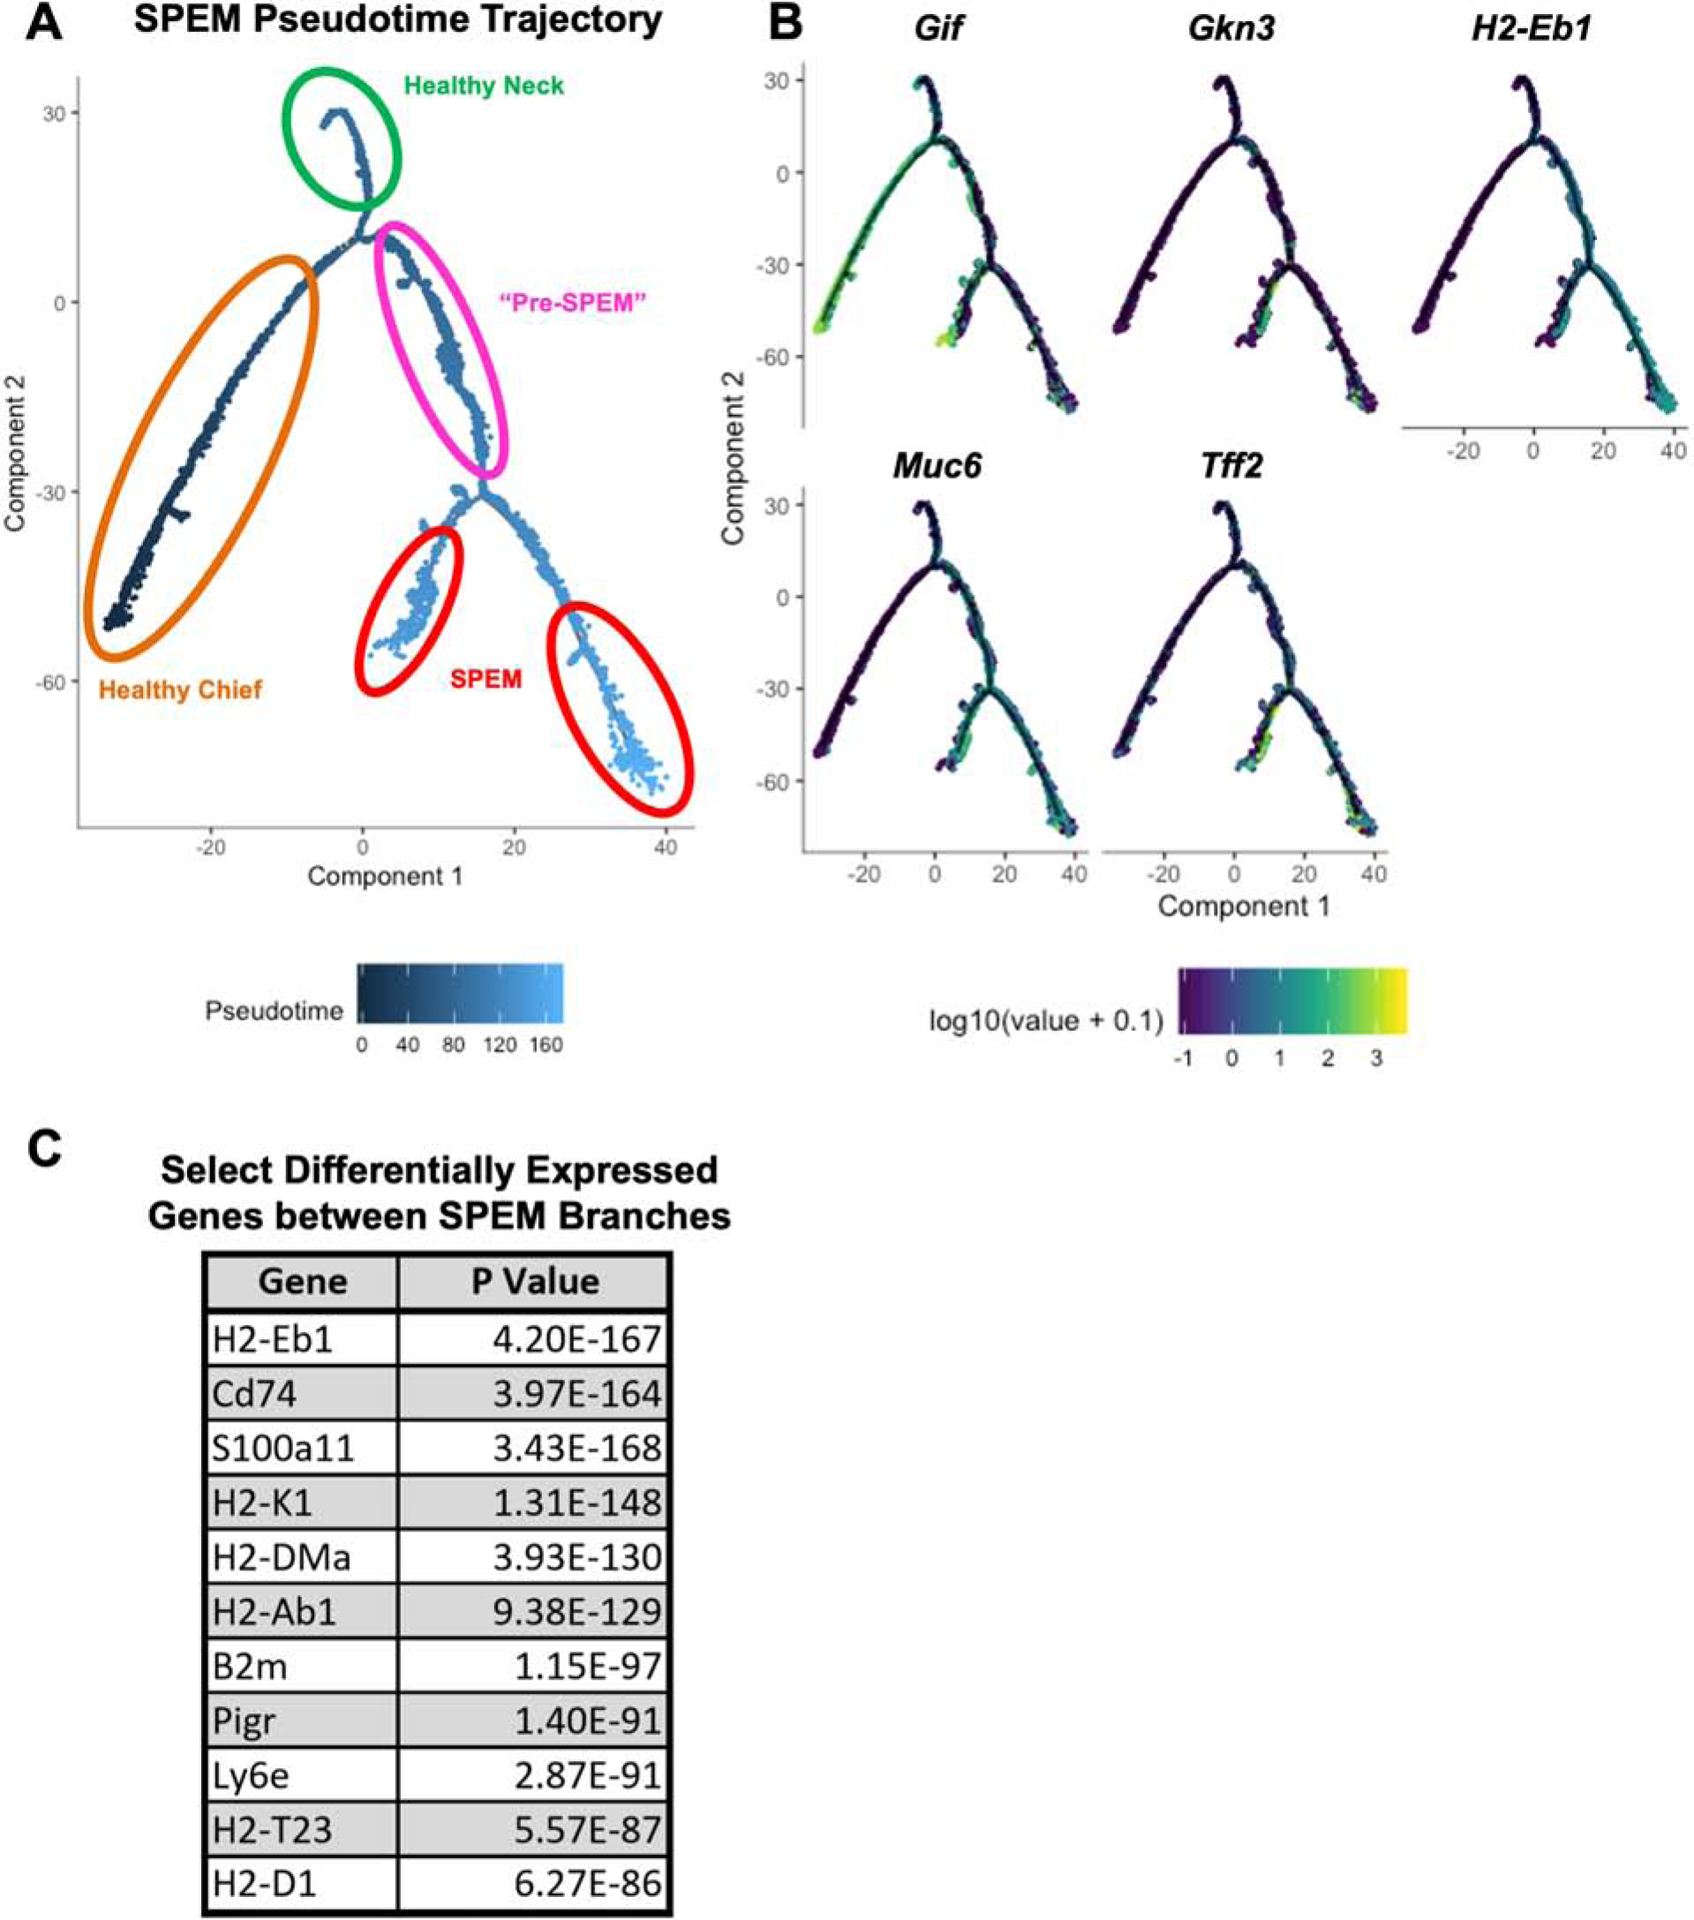
Figure 6. Pseudotime trajectory analysis traces the origins of inflammation-induced SPEM to both mucous neck cells and chief cells.

(A) Calculated pseudotime trajectory based on differentially expressed genes in healthy and inflamed mucous neck cells, healthy and inflamed chief cells, and SPEM cells. Cells are colored according to computed pseudotime coordinate, with darker cells denoting earlier time points in the trajectory and lighter cells denoting later time points. Branches of the timeline containing healthy chief cells (orange), healthy mucous neck cells (green), “Pre-SPEM” comprised of inflamed mucous neck and chief cells (pink), and SPEM cells (red) are circled. (B) Pseudotime trajectory as shown in Figure 4A, but cells are now colored according to gene expression for Gif, Gkn3, Muc6, Tff2, and H2-Eb1. Darker cells indicate lower expression, lighter cells indicate higher expression. (C) Select significant differentially expressed genes between the terminal SPEM branches shown in 4A.
