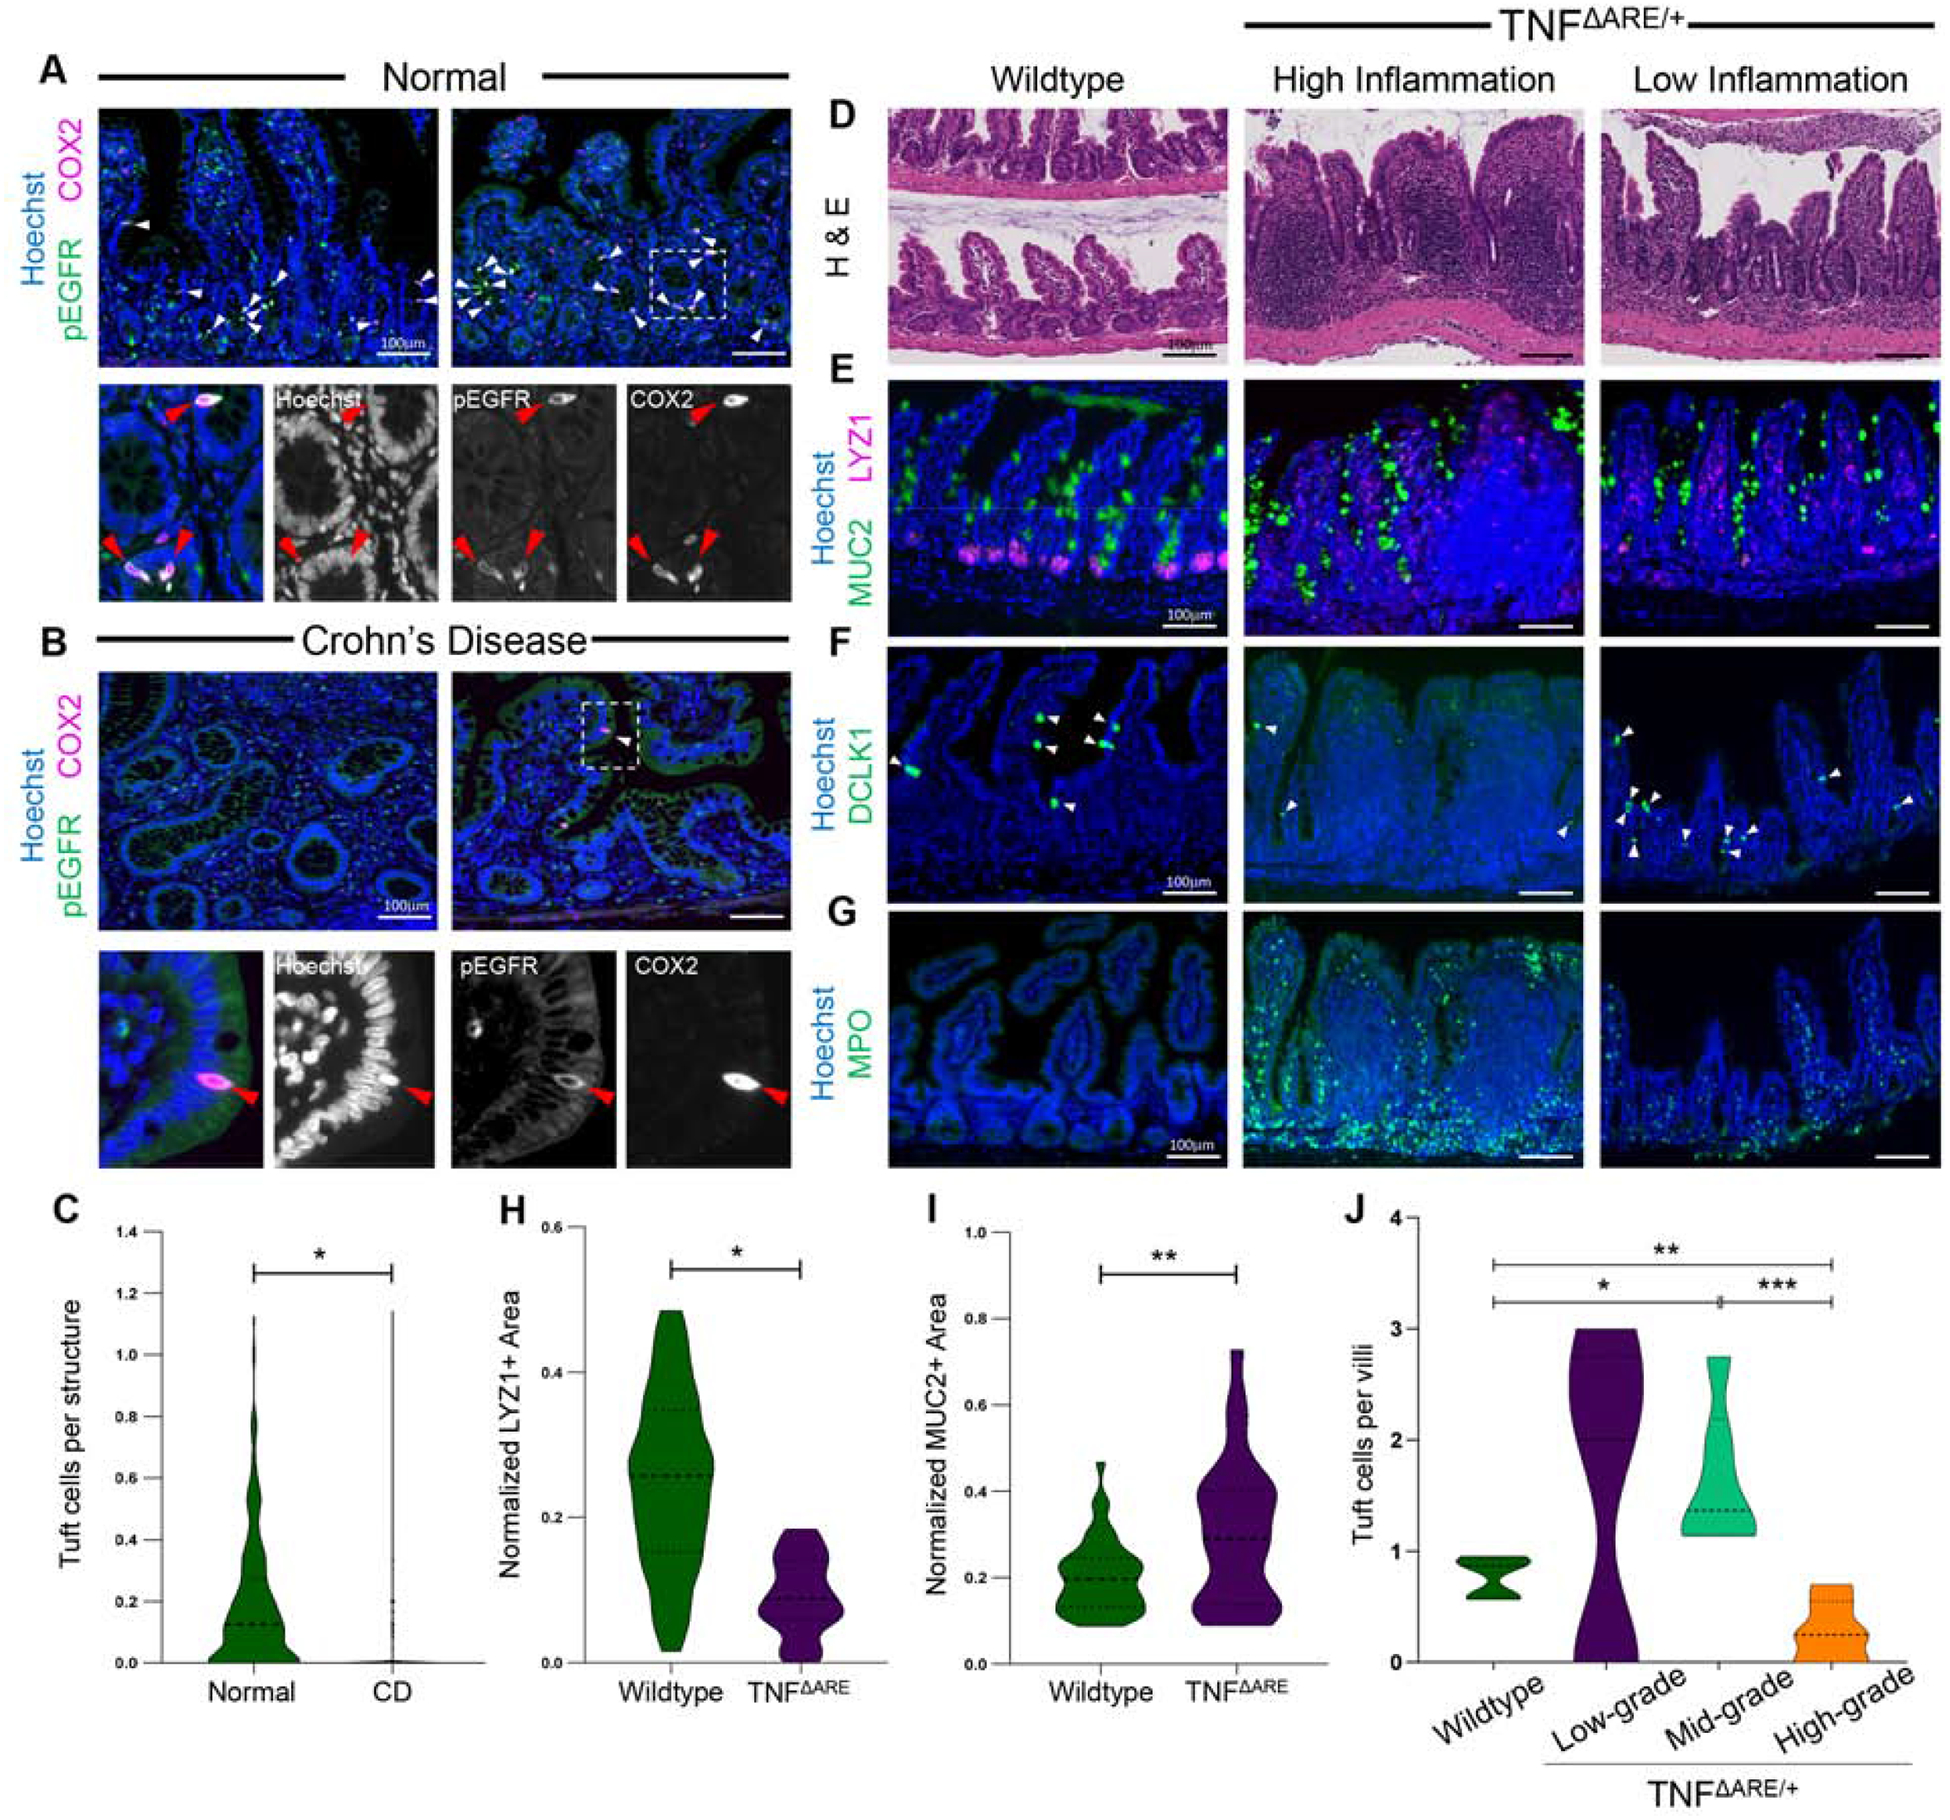
Figure 1. Tuft cell number is decreased in inflamed tissue with ileal inflammatory disease.

IF of tuft cell staining in human ilea of (A) healthy and (B) CD patients. Arrows denote co-expression. (C) IF quantification for tuft cells per crypt/villus. SEM for n = 11 normal and n = 14 CD patients. H&E (D) and (E-G) IF of cell markers of inflamed and uninflamed distal ilea from mice. (H-I) IF quantification for marker area normalized to Hoechst area per crypt. SEM for n = 4 mice for LYZ and 3 for MUC2. (J) IF quantification of DCLK1+ tuft cells in wildtype (n = 146 villi) and TNFΔARE/+ villi, by low- (n = 11), mid- (n = 125), and high-grade (n = 62) inflammation. p-value * < 0.05, ** < 0.01, *** < 0.001.
