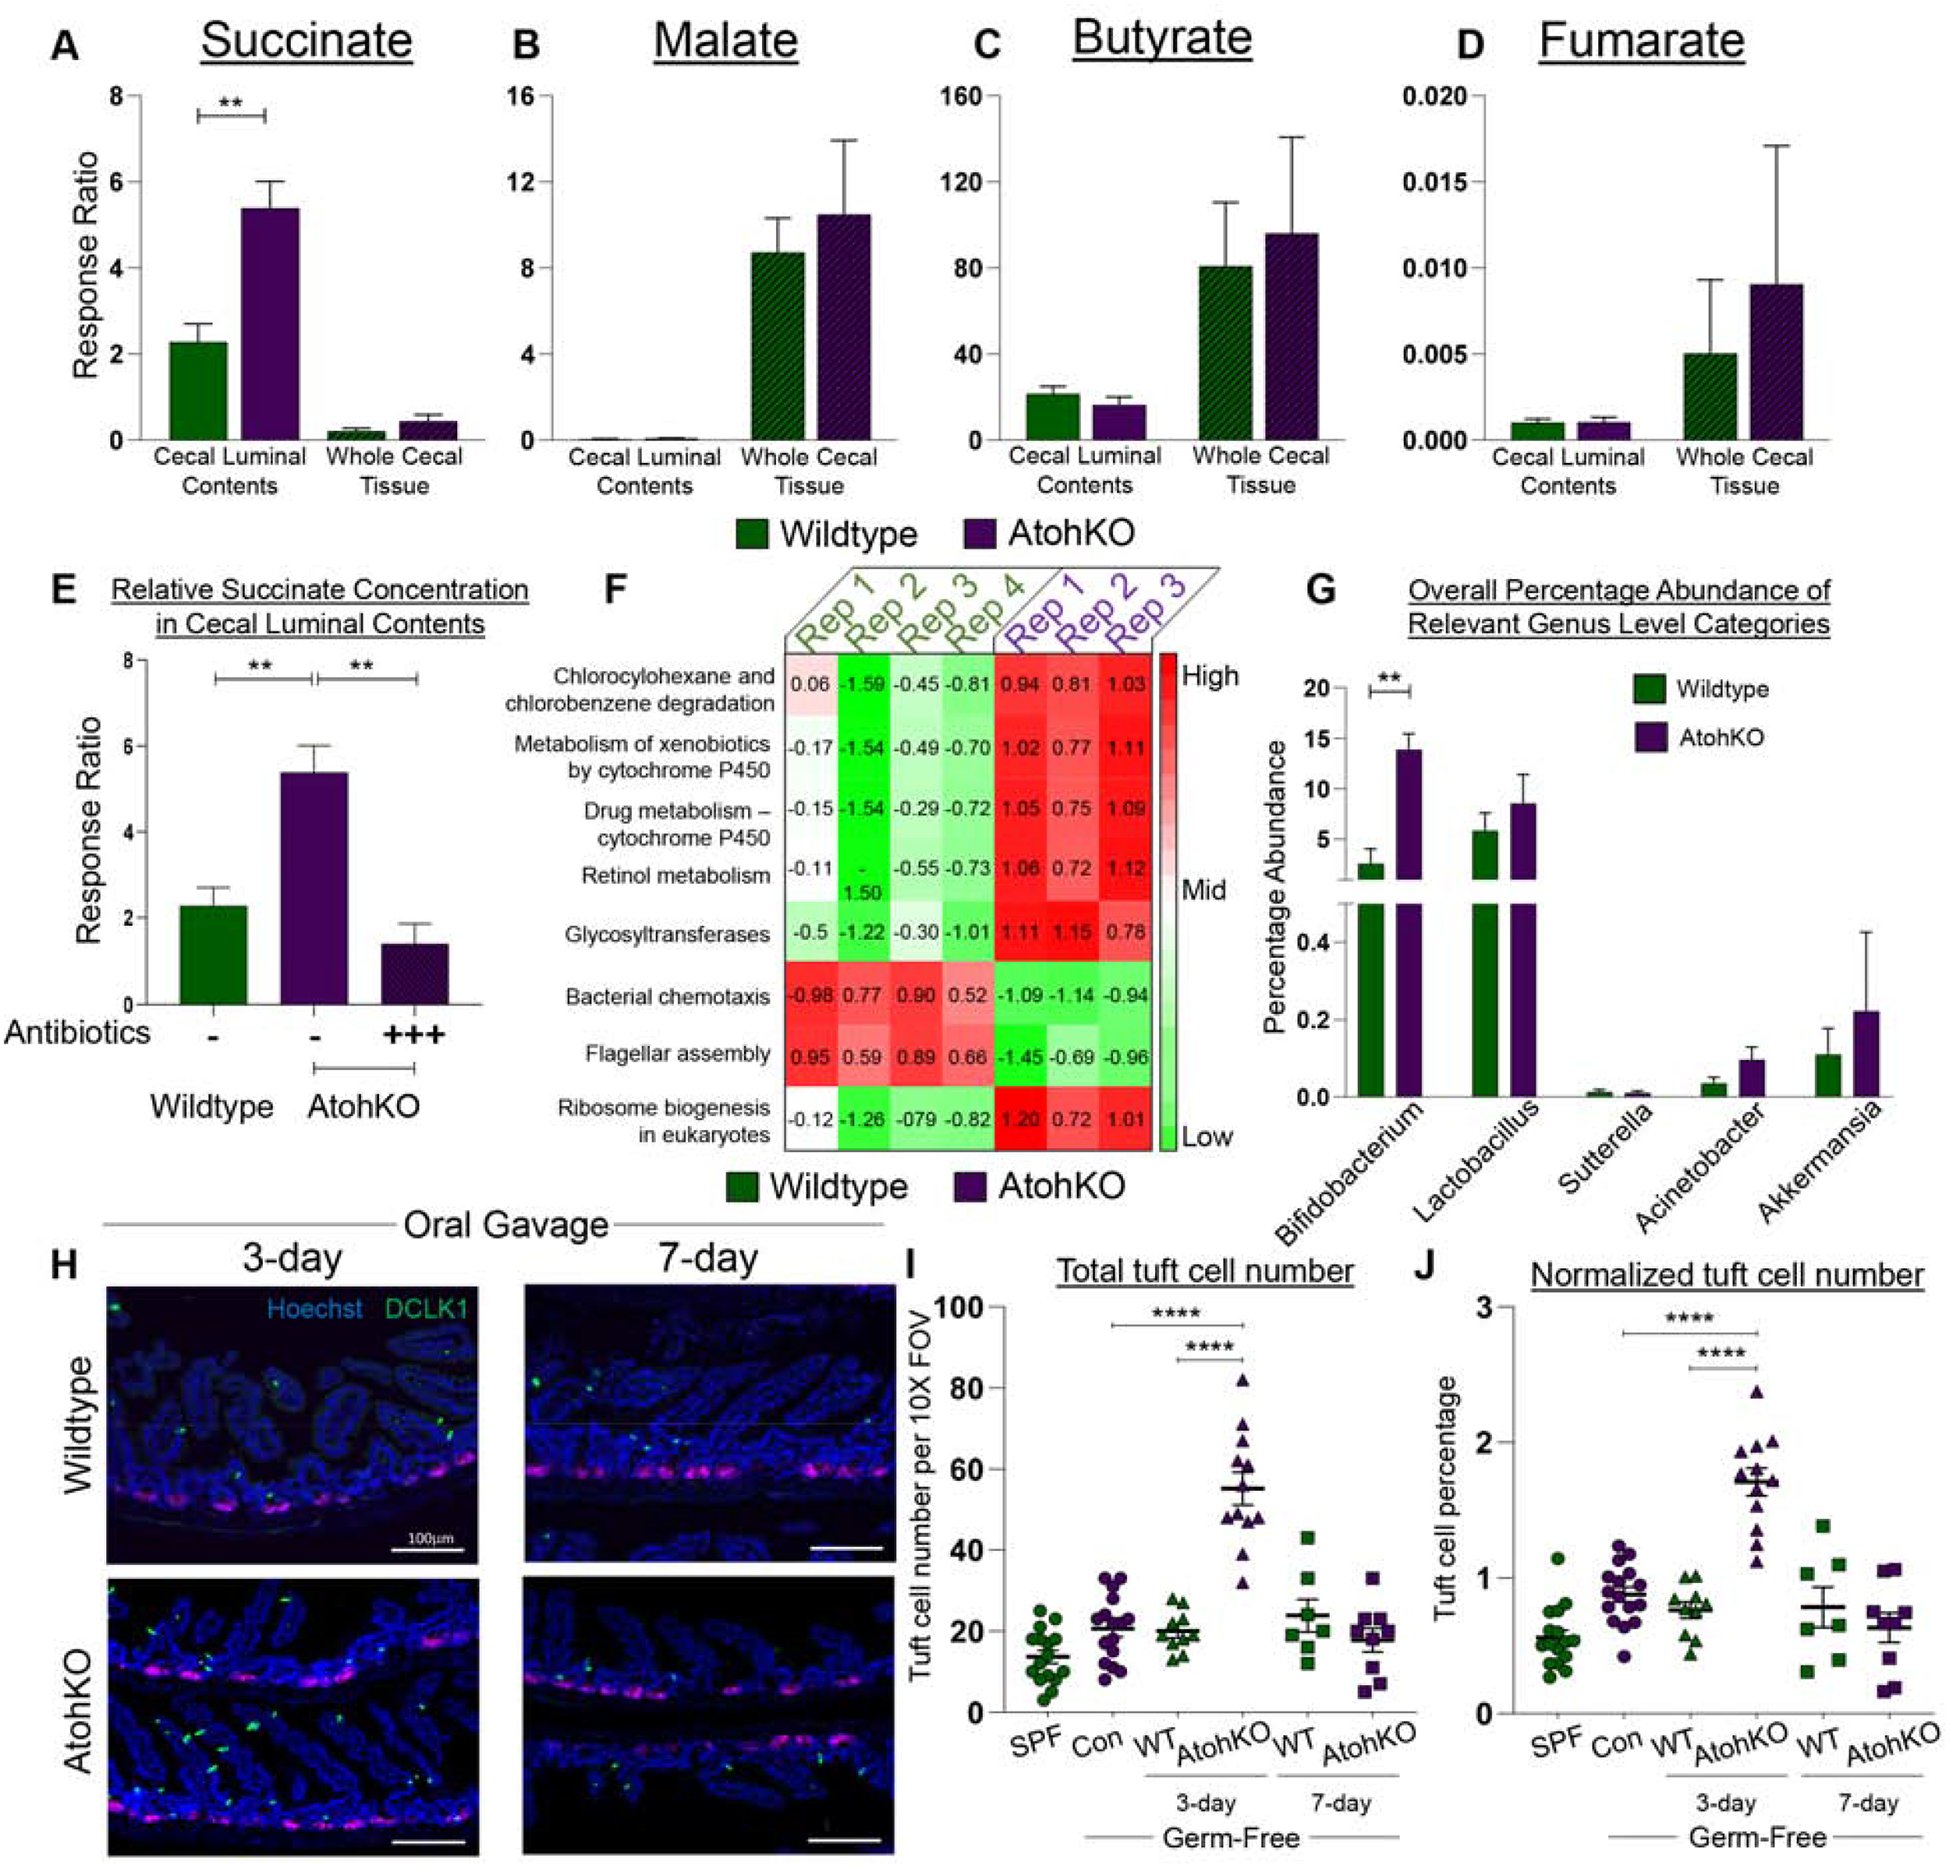
Figure 5. Succinate production in the AtohKO small intestine drives ATOH1-independent tuft cell expansion.

(A-E) Mass spectrometric measurements of metabolites from the cecal lumen and tissue. SEM for n = 5 wildtype, 3 AtohKO, and 3 antibiotic-treated AtohKO animals. (F) Heatmap of z-score normalized PICRUSt category scores between wild type and AtohKO. Categories p-values are all < 0.05. (G) Relative abundance of genus contributing to “Chlorocyclohexane and chlorobenzene degradation” category. SEM for n = 4 wildtype and 3 AtohKO. (H) IF for cell markers of GF animals gavaged with wildtype or AtohKO contents, at 3-days or 7-days. (I) Raw and (J) normalized (to nucleus count) tuft cell number in untreated and oral-gavaged animals. Datapoints represent FOVs and SEM across multiple biological replicates calculated. p-value ** < 0.01, **** < 0.0001.
