Figure 3:

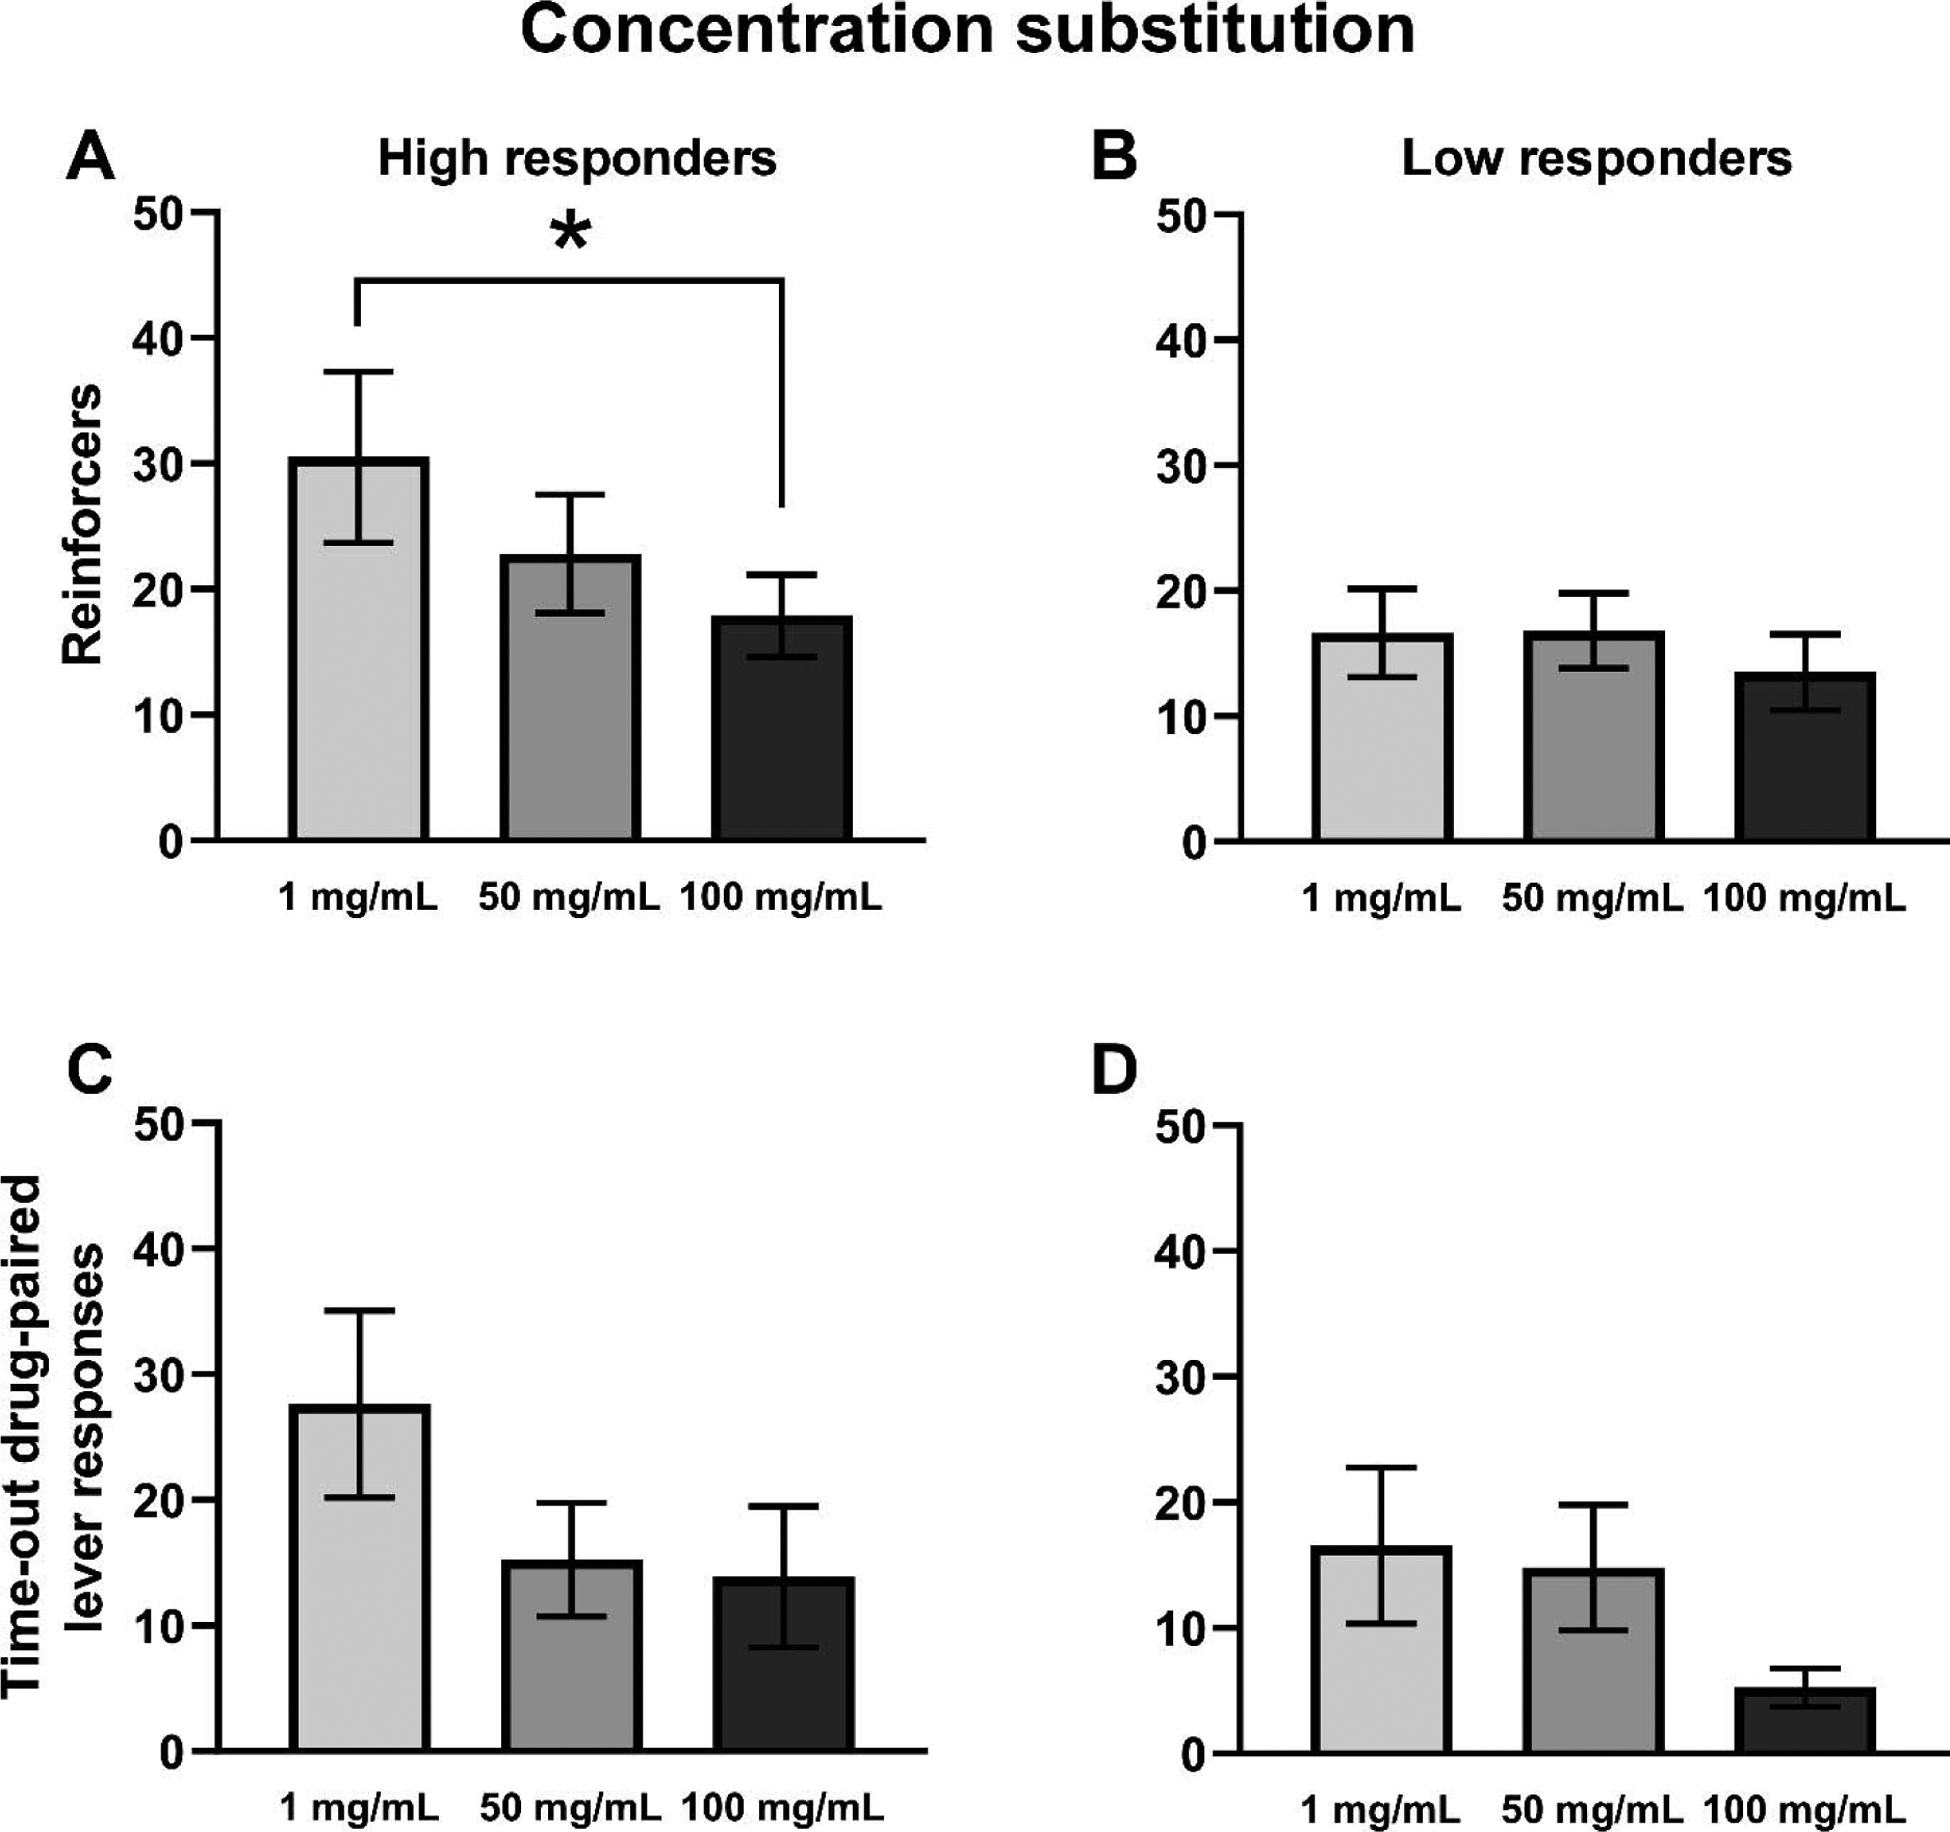
Mean (±SEM) reinforcer deliveries (A, B) and time-out drug-associated lever responding (C, D) for High (A, C) and Low (B, D) Responder sub-groups. A significant difference between concentrations is indicated with *.

Mean (±SEM) reinforcer deliveries (A, B) and time-out drug-associated lever responding (C, D) for High (A, C) and Low (B, D) Responder sub-groups. A significant difference between concentrations is indicated with *.