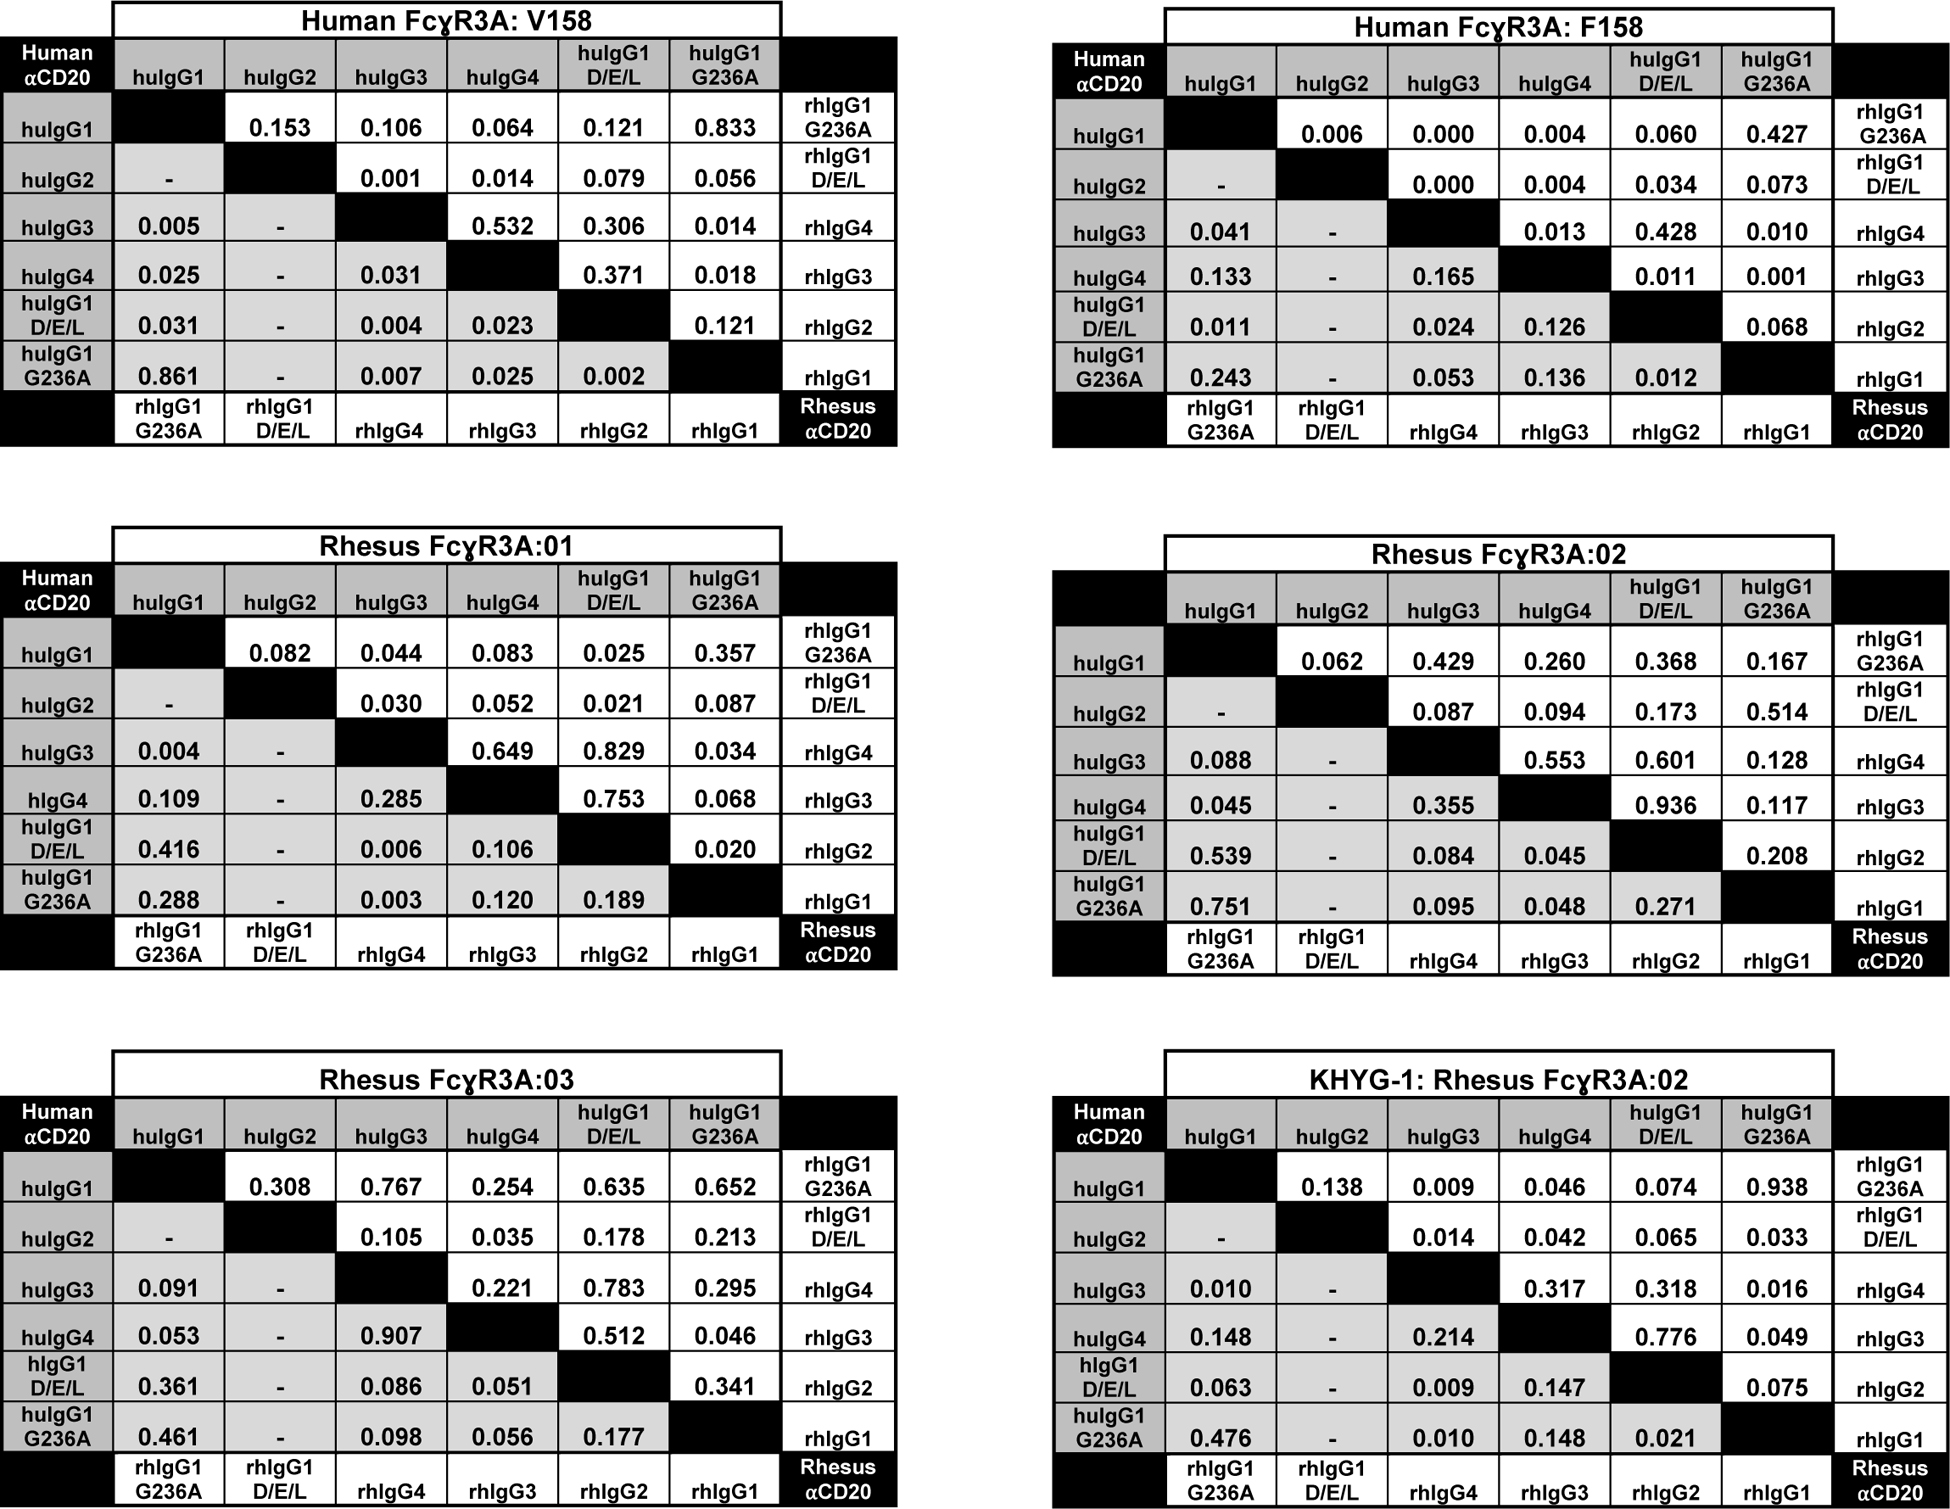
Table IV. Statistical comparisons of EC50 values.
Statistical comparison of EC50 values for FcγR3A-mediated responses. The p-values are shown for statistical comparisons of mean antibody concentrations (EC50) for half-maximal responses and were determined using an unpaired, two-tailed Student’s t test. Dashes indicate comparisons with undefined EC50 values.

|
