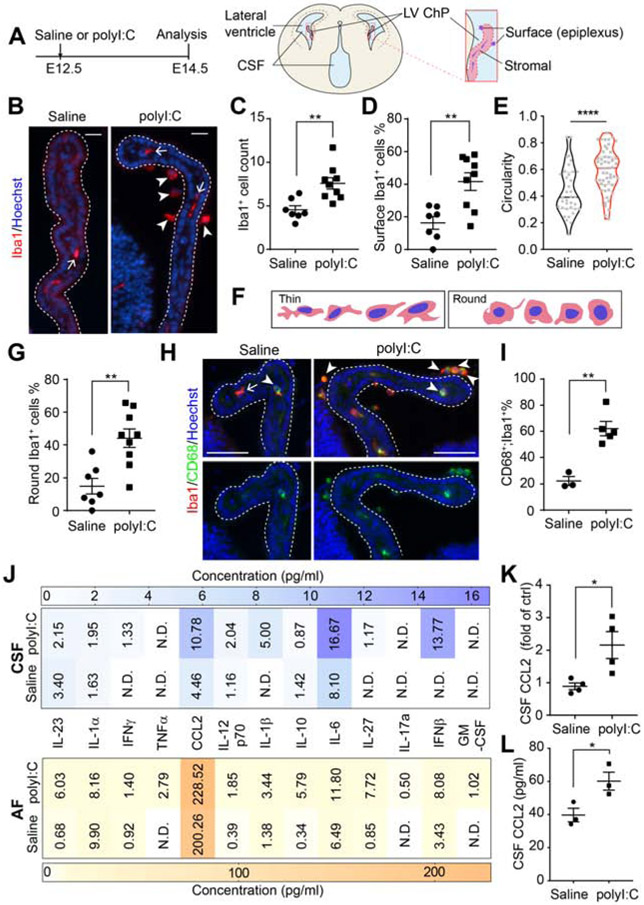
Figure 1. MIA triggers macrophage accumulation at the embryonic ChP and modifies CSF composition.
(A) Schematic of experimental paradigm and E14.5 brain. (B) LV ChP macrophages from saline- or polyI:C conditions. Arrow: macrophages in ChP stromal space; arrowheads: macrophages at ChP surface. Scale = 20 μm. (C) Iba1+ macrophage numbers per LV ChP. **P = 0.0030, unpaired t-test. (D) Percent of epiplexus ChP macrophages. **P = 0.0029, unpaired t-test. (E) Iba1+ macrophage circularity. ****P < 0.0001, unpaired t-test. Dashed lines: median and quartile values. Data points: individual cells. (F) Schematic depicting major morphological states of Iba1+ macrophages at E14.5. (G) Round ChP Iba1+ macrophages (% of total). **P = 0.0020, unpaired t-test. See also Figure S1F. (H) CD68+ macrophages from MIA E14.5 LV ChP Arrows: “thin” macrophage, CD68−;Iba1+; arrowheads: “round” macrophages, CD68+;Iba1+. Scale = 50 μm. (I) Macrophages (Iba1+) that are phagocytic (CD68+;Iba1+, in %) in (H) (% of total). **P = 0.0021, unpaired t-test. (J) Cytokines and chemokines in E14.5 CSF and AF. n ≥ 4 litters per group. (K) Relative changes in CCL2 in CSF samples from (J). *P = 0.025, unpaired t-test. (L) E14.5 CSF [CCL2] analyzed by sandwich ELISA. n = 3 litters per group, *P = 0.0039, unpaired t-test. All data presented as mean ± S.E.M., except in (J) where mean values are presented. See also Figure S1, Tables S1-S2.

