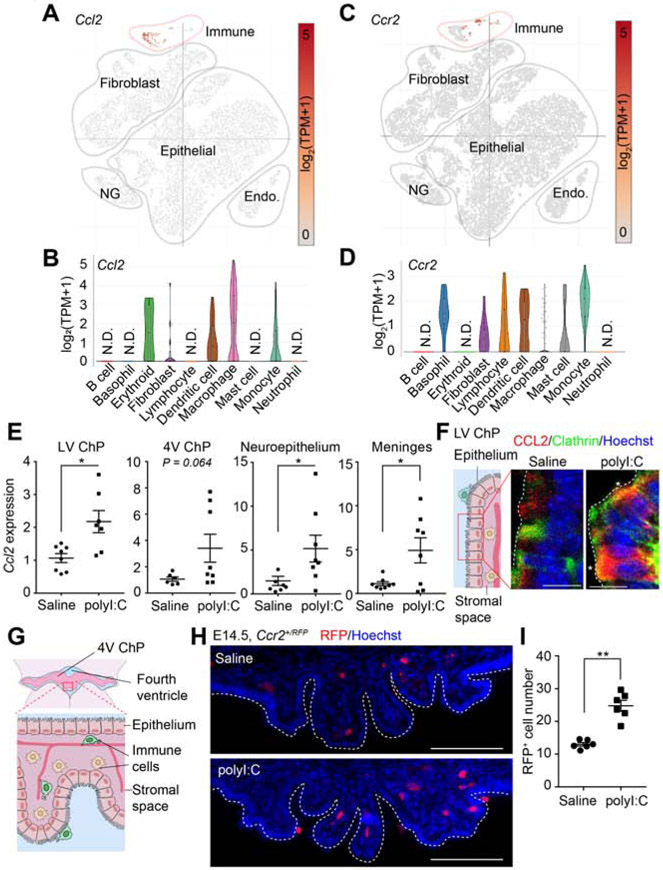
Figure 2. MIA is accompanied by increased CCL2-CCR2 signaling at the ChP-CSF barrier.
(A) Ccl2 and (B) Ccr2 expression in E16.5 ChP from Dani et al., bioRxiv, 2019. Endo: endothelial cells; NG: neuroglia. (C-D) Violin plots showing Ccl2 (C) and Ccr2 (D) expression in embryonic ChP immune cell subclusters from Dani et al., bioRxiv, 2019. (E) Ccl2 expression (qRT-PCR) in CSF-contacting tissue following MIA, normalized to saline. LV ChP: *P = 0.016; Neuroepithelium, *P = 0.031; Meninges: *P = 0.033 Welch’s t-test. One outlier in polyI:C LV ChP sample and one outlier in saline neuroepithelium sample were removed using the ROUT method (Q = 1%). (F) ChP schematic and representative images of CCL2 cellular distribution in LV ChP. Asterisks: co-localization of CCL2 and Clathrin. Scale = 10 μm. See also Figure S2D for antibody validation. (G) E14.5 4V ChP schematic. (H) Ccr2+/RFP monocytes in 4V ChP of MIA E14.5 Ccr2+/RFP samples. Scale = 100 μm. (I) Ccr2+/RFP monocyte numbers (per LV ChP) for (H). ****P < 0.0001, unpaired t-test. All data presented as mean ± S.E.M. See also Figure S2.

