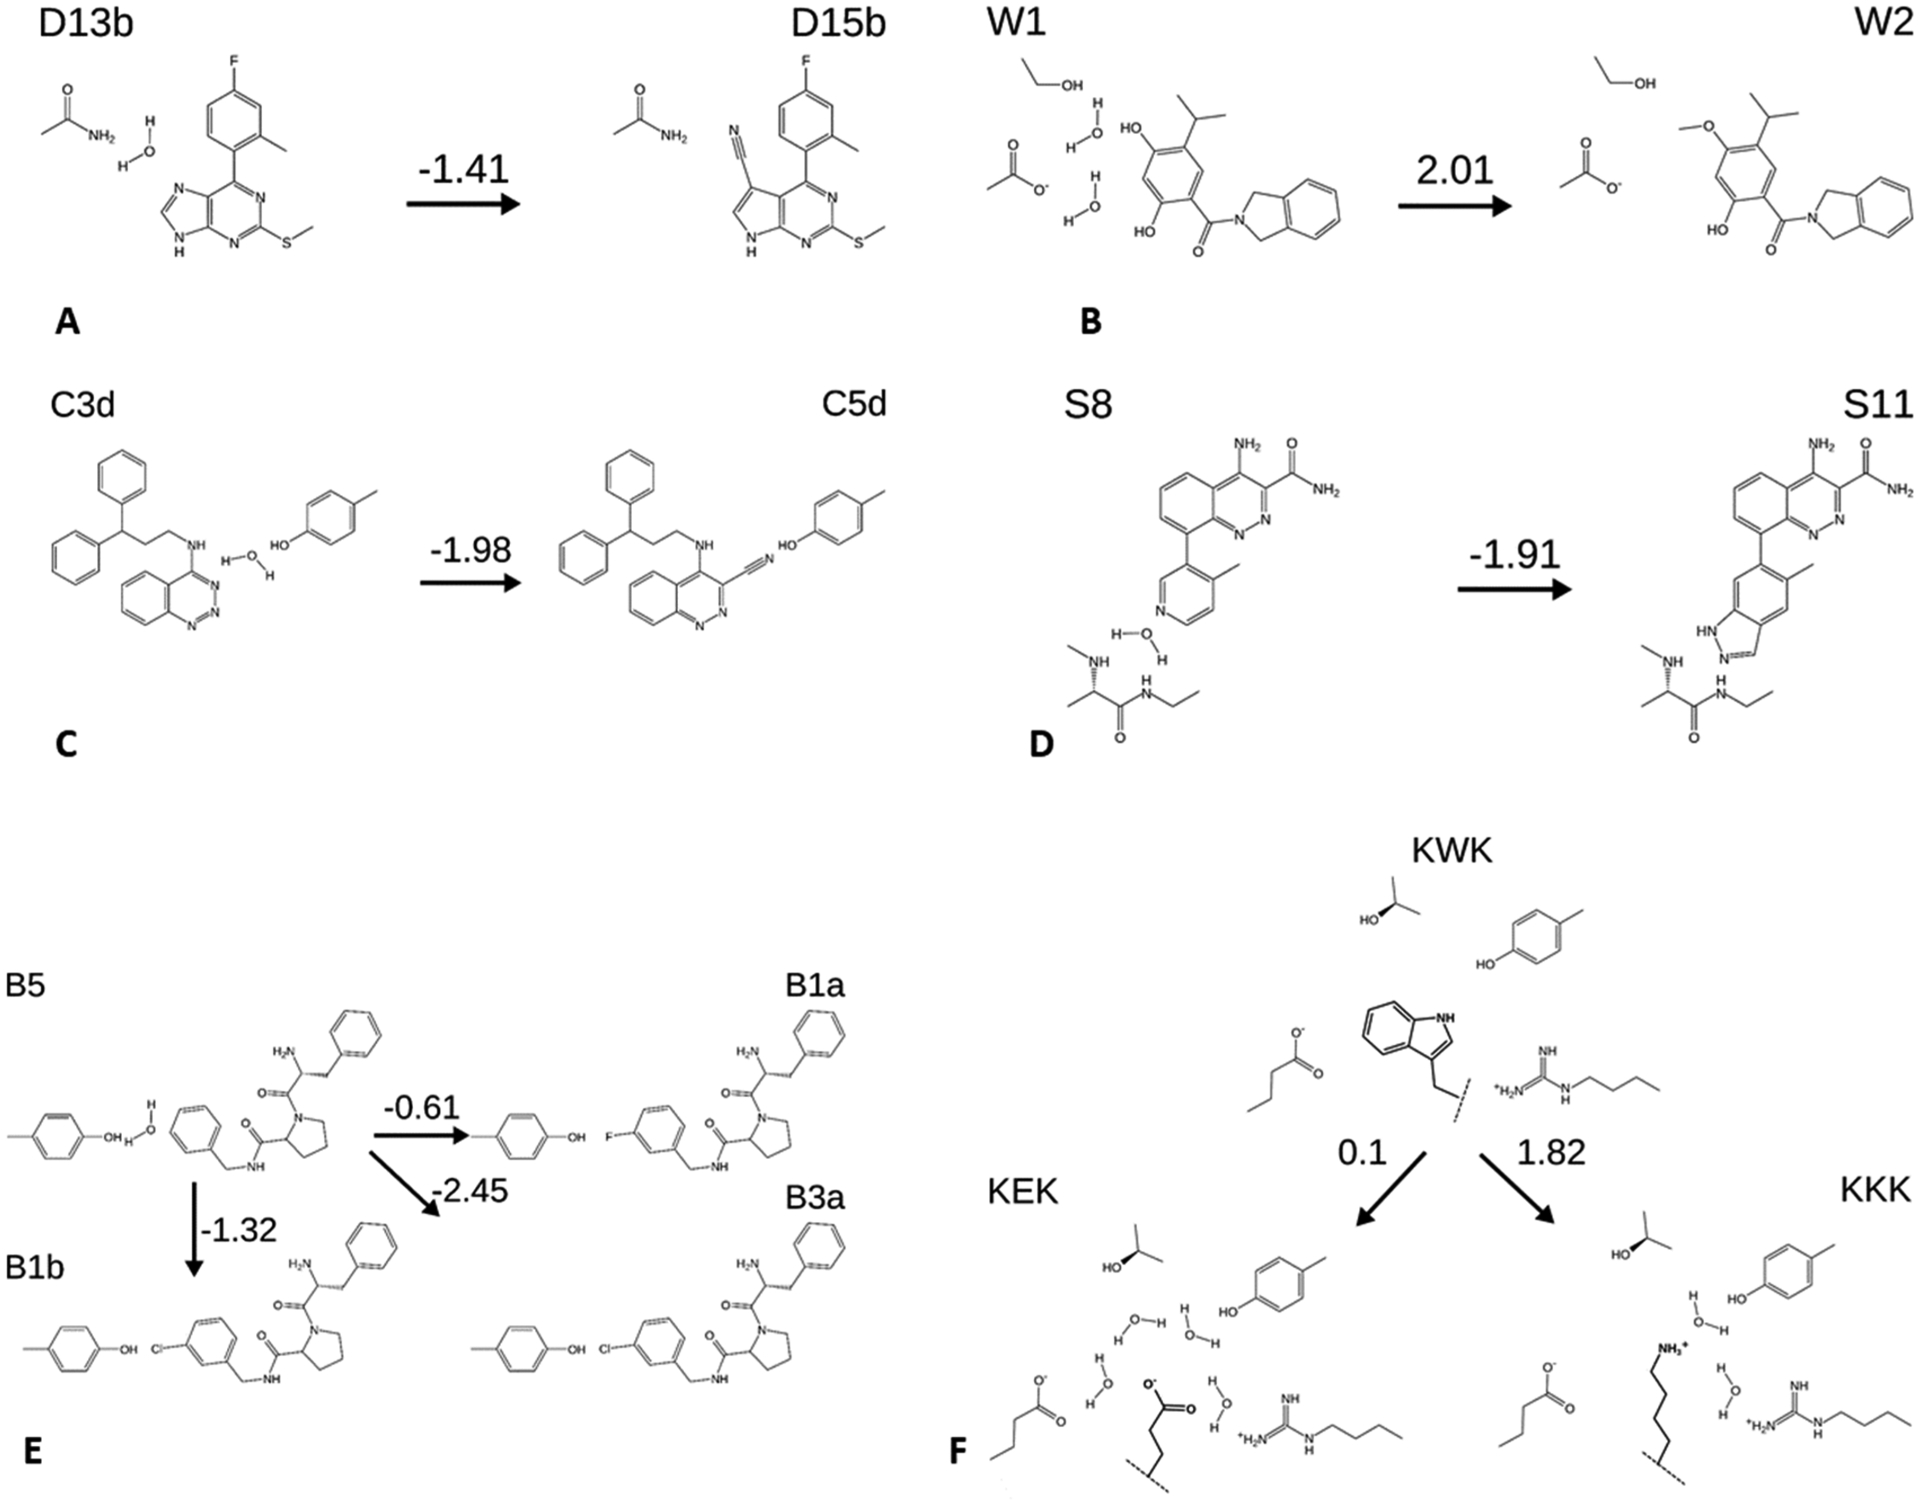
Figure 3.

Perturbations considered in this study, with schematic representations of water displacements and selected neighboring side chains. Numbers above arrows are the experimental free energy changes (kcal mol−1). (A,B) Ligands D13b and D15b and W1 and W2, all HSP90 inhibitors. (C) C3d and C5d, Scytalone dehydratase inhibitors. (D) S8 and S11, BTK inhibitors. (E) B1a, B1b, B3a, and B5, thrombin inhibitors. (F) peptides KEK, KKK, KWK, OppA inhibitors. Dashed lines indicate linkage to the rest of the peptide, which is not changed in these perturbations. Structures are shown with the charge states used in the simulations. Binding free energies are draw from the citations in Table 2.
