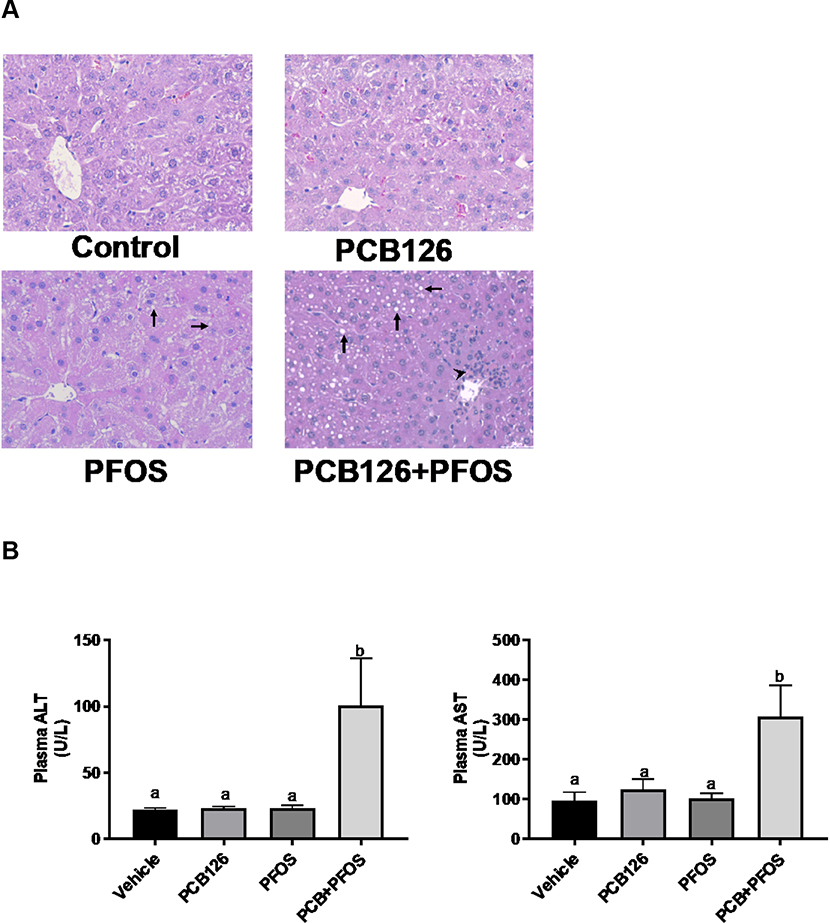
Figure 2. Effects of PCB126 (0.5 mg/kg), PFOS (250 mg/kg), and PCB126+PFOS (0.5 mg/kg+250 mg/kg) mixture exposure on liver injury.
(A) H&E staining of hepatic sections established the apparent lipid accumulation (arrow) and inflammatory cell infiltration around the periportal area (arrow head) in the mixture exposed group. (B) Elevated plasma ALT and AST levels were observed in the mixture exposed group. Bars represent mean ± SEM of eight animals in each group. Different subscript letters (a, b, c) indicate statistical significance (p<0.05) by one-way ANOVA and post hoc Tukey’s test.

