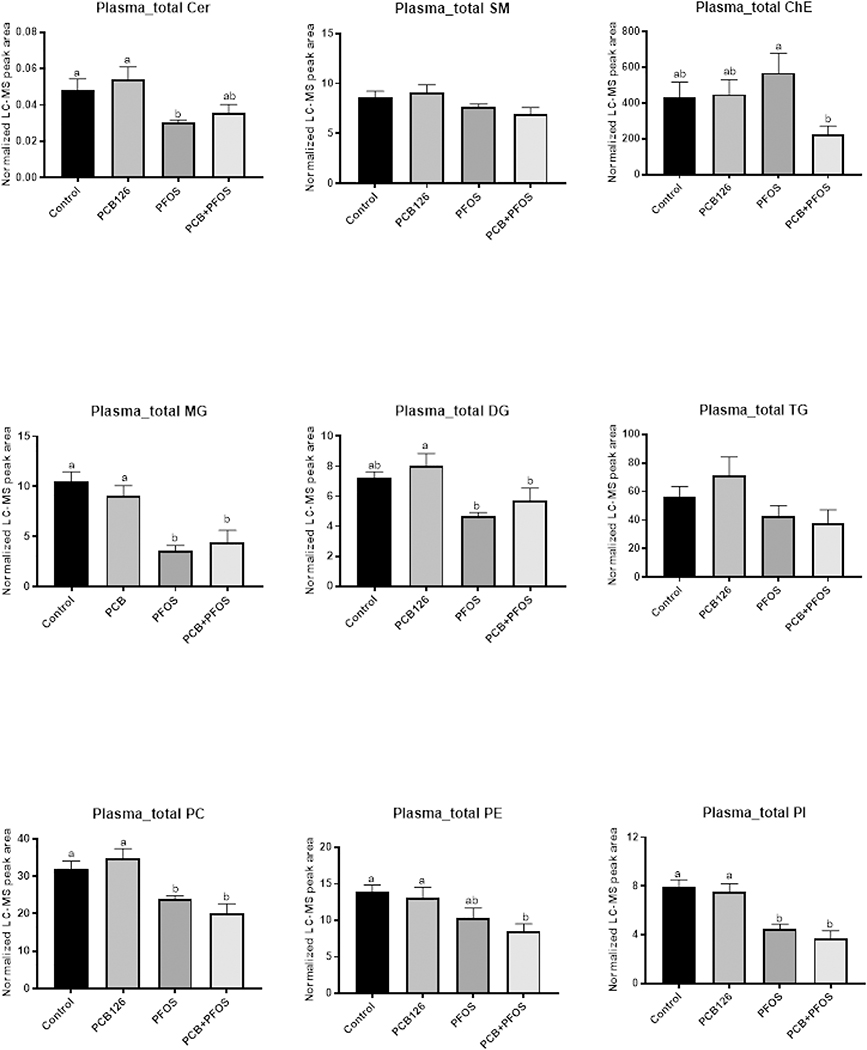
Figure 4. Effects of PCB126 (0.5 mg/kg), PFOS (250 mg/kg), and PCB126+PFOS (0.5 mg/kg+250 mg/kg) mixture exposure on plasma lipid levels.
Lipids including cholesterol ester (ChE), sphingolipids (Cer, SM), neutral lipids (MG, DG, TG), and phospholipids (PC, PE, PI) were analyzed using UHPLC-Q Exactive mass spectrometer. The normalized peak areas of lipid species in each lipid class were summarized. Bars represent mean ± SEM of eight animals in each group. Different subscript letters (a, b) indicate statistical significance (p<0.05) by one-way ANOVA and post hoc Tukey’s test.

