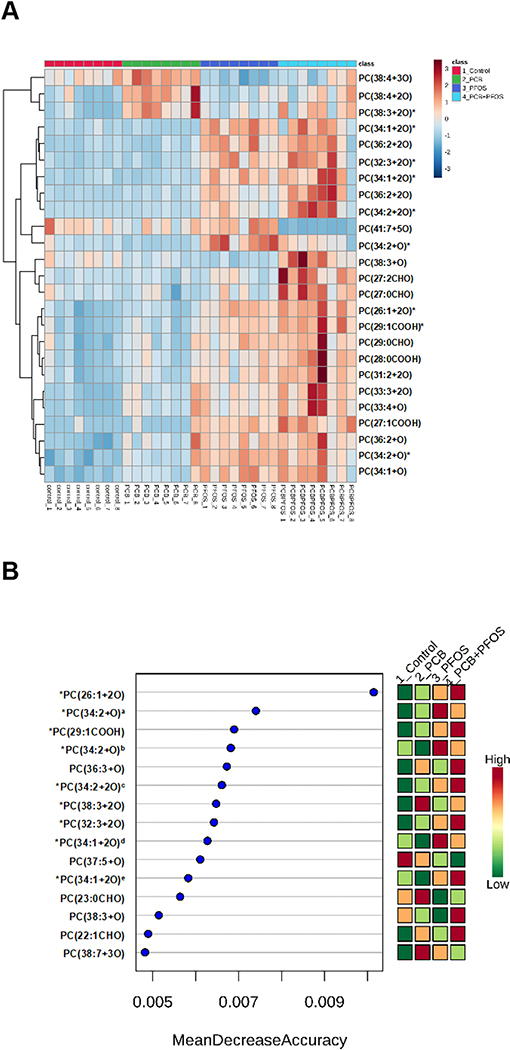
Figure 7. Effects of PCB126 (0.5 mg/kg), PFOS (250 mg/kg), and PCB126+PFOS (0.5 mg/kg+250 mg/kg) mixture exposure on liver OxPLs profiles.
OxPLs were analyzed using UHPLC-Q Exactive mass spectrometer. (A) Heat map showing the top 25 OxPLs that were differentially expressed in different groups identified using ANOVA. Each column corresponds to the OxPLs from an individual mouse, and each row corresponds to a given OxPLs. (B) Variable-importance plot of the top OxPLs identified by random forest analysis. The mean accuracy value decrease is a measure of how much predictive power is lost if a given metabolite is removed or permuted in the random forest algorithm; thus, the more important a metabolite is to classifying samples into time point categories, the further to the right its point is on the graph. *: OxPLs identified by both ANOVA and random forest analysis. a: PC(34:2+O) with the retention time at 7.49 min, b: PC(34:2+O) with the retention time at 8.33 min, c: PC(34:2+2O) with the retention time at 8.77 min, d: PC(34:1+2O) with the retention time at 6.47 min, e: PC(34:1+2O) with the retention time at 8.59 min. See also Table 1 for detailed information on OxPLs.

