
Fig.7.
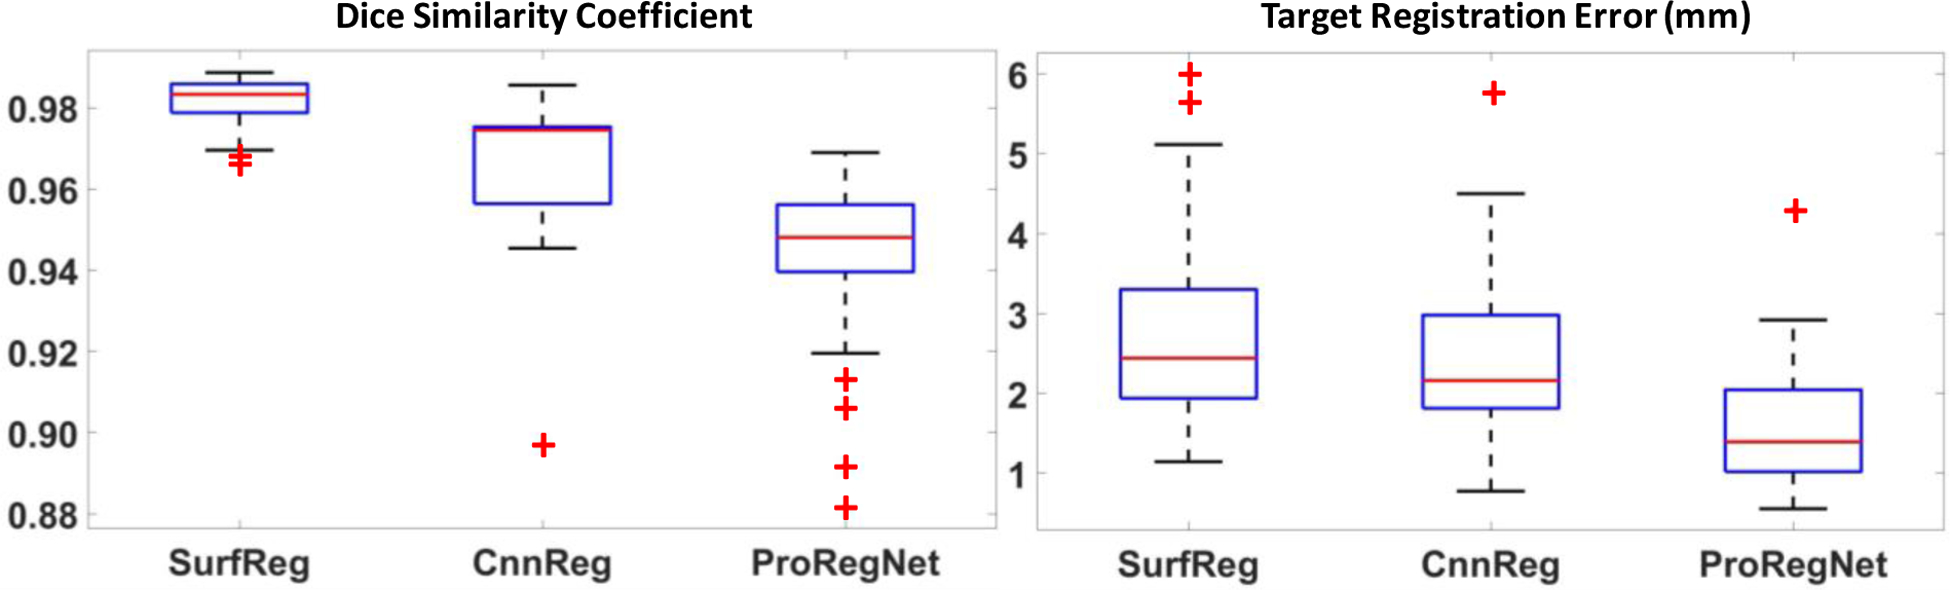
Boxplots of DSC and TRE for SurfReg, CnnReg and ProRegNet. The central mark in the boxplot is the median, the top and bottom edges of the box indicate the 75th and 25th percentiles, respectively. The dashed line in boxplot extends to the most extreme data points that are not outliers. Outliers are shown as red ‘+’ symbol.