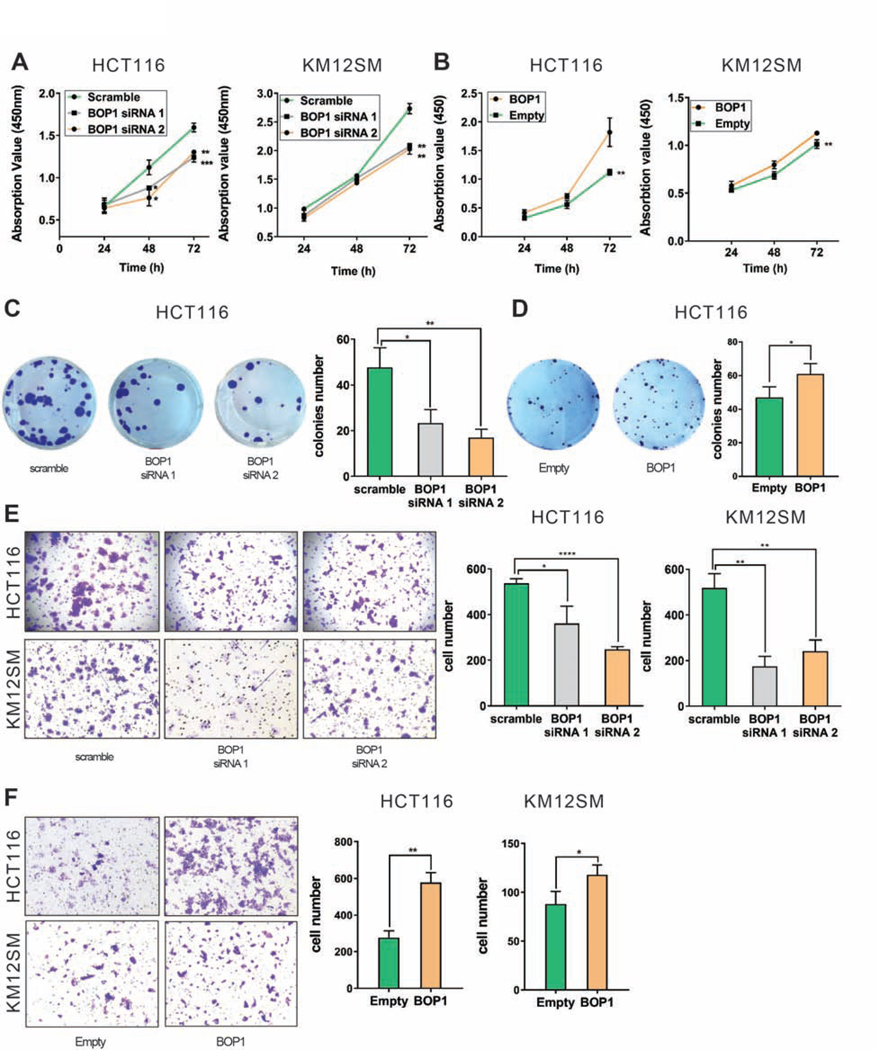
Figure 5. BOP1 plays an oncogenic role in CRC.
(A) Proliferation rate of HCT116 (left) and KM12SM (right) after siRNA knock-down of BOP1. (B) Proliferation rate of HCT116Empty and HCT116BOP1 (left) and KM12SMEmpty and KM12SMBOP1 (right). (C, D) Representative images of colony formation assay in HCT116 with BOP1 knock-down (C) and HCT116 with stable overexpression of BOP1 (D). Quantitative analysis of colony numbers (right side of panels C and D). (E) Invasion potential of HCT116 and KM12SM cells after transfection with BOP1 siRNA. Representative images of invasion assay for HCT116 (upper panel) and KM12SM (lower panel). Quantitative analysis of invading cell (right panel). (F) Invasion potential in cells with stable overexpression of BOP1. Representative images of invasion assay for HCT116 (upper panel) and KM12SM (lower panel). Quantitative analysis of invading cell (right panel). Mean ± SD. (*P < .05), (**P < .01); (***P < .001), (****P < .0001).

