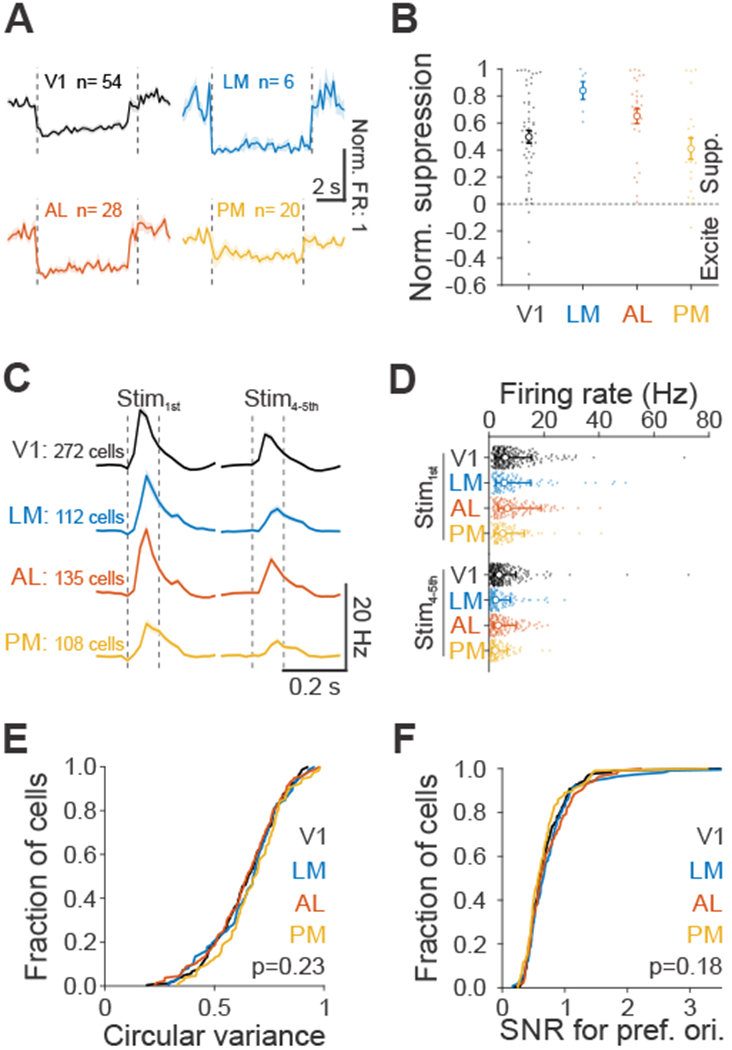
Figure 3 – Comparison of suppression efficacy and visually driven response properties across mouse visual areas.

(A) Average spontaneous firing rates (FR), normalized to baseline FR, during ChR activation with blue light for each area. Dashed vertical lines indicate light onset and offset. Cells that were excited were removed and recordings from viral (V; Figure 1) and transgenic (T; Figure S2) approaches were combined (V1: n= V:29, T:25; LM: n= V:6, T:0; AL: n= V:17, T:11; PM: n= V:6, T:14). Shaded error is SEM across cells. (B) Normalized suppression across areas, summarized from A. Small filled dots are individual cells, open circles are means across population and error bars are SEM across cells. (C) Grand average of neuronal response to first (left, Stim1st) and plateaued fourth and fifth stimuli (right, Stim4-5th) at its preferred orientation for visually responsive cells (V1: n=272; LM: n=112; AL: n=135; PM: n=108 cells). Dashed vertical lines indicate visual stimulus onset and offset. Shaded error is SEM across cells. (D) Summary of neuronal response to Stim1st (top) and Stim4-5th (bottom) for cells in C. Each small filled dot is a single cell, open circle is the median of the population and error bars are 25th and 75th percentile. (E) Cumulative distribution of the circular variance responses across orientations, for each area. Same cells as in C. (F) Same as E, for signal-to-noise ratio (SNR, mean/std) at the preferred orientation for each cell.
