
Figure 5 – Role of areas AL and PM in detecting speed increment.
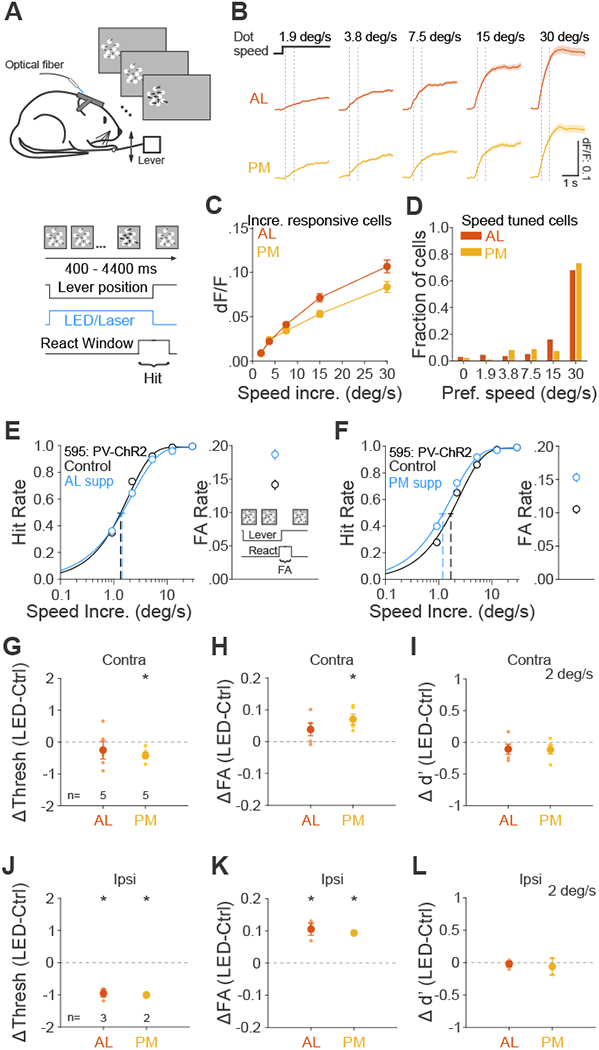
(A) Schematic of speed increment detection task. Base dot speed: 0.5 deg/s, dot coherence: 0%. Thicker arrows indicate an increase in dot speed. (B) Grand average of change in fluorescence (dF/F) in response to each speed increment for all cells significantly responsive to speed increments in area AL (top, n=669 cells) and PM (bottom, n=516). Black step horizontal lines show the onset and duration of the speed increment from the base dot speed. Dotted vertical lines show the window for calculating response for each cell in C (200-733 ms after onset). (C) Summary of neuronal responses of same cells in B to each speed increment. Error is SEM across cells. (D) Summary of the fraction of speed tuned cells that prefer each speed increment (AL: n=337 cells; PM: n=169). (E-F) Effect of suppression in area AL (E) and PM (F) on hit rate (left) and FA rate (right) for an example mouse. Note that this is the same mouse from Figure 4D–E. (G-I) Summary of effect of suppression in AL and PM in terms of the change in the threshold (G), FA rate (H) and sensitivity (d’ for 2 deg/s speed increment, I). Big circles are the population mean and small circles are data for each mouse. The visual stimulus is presented in the contralateral field of view (relative to the ChR2 injection site). Error bars indicate ± SEM across mice (n=5, 5 for AL and PM). * p<0.05. (J-L) Same as G-I, for visual stimulus presentation in the ipsilateral field of view. n=3, 2 for AL and PM. See also Figure S4 and Data S5.