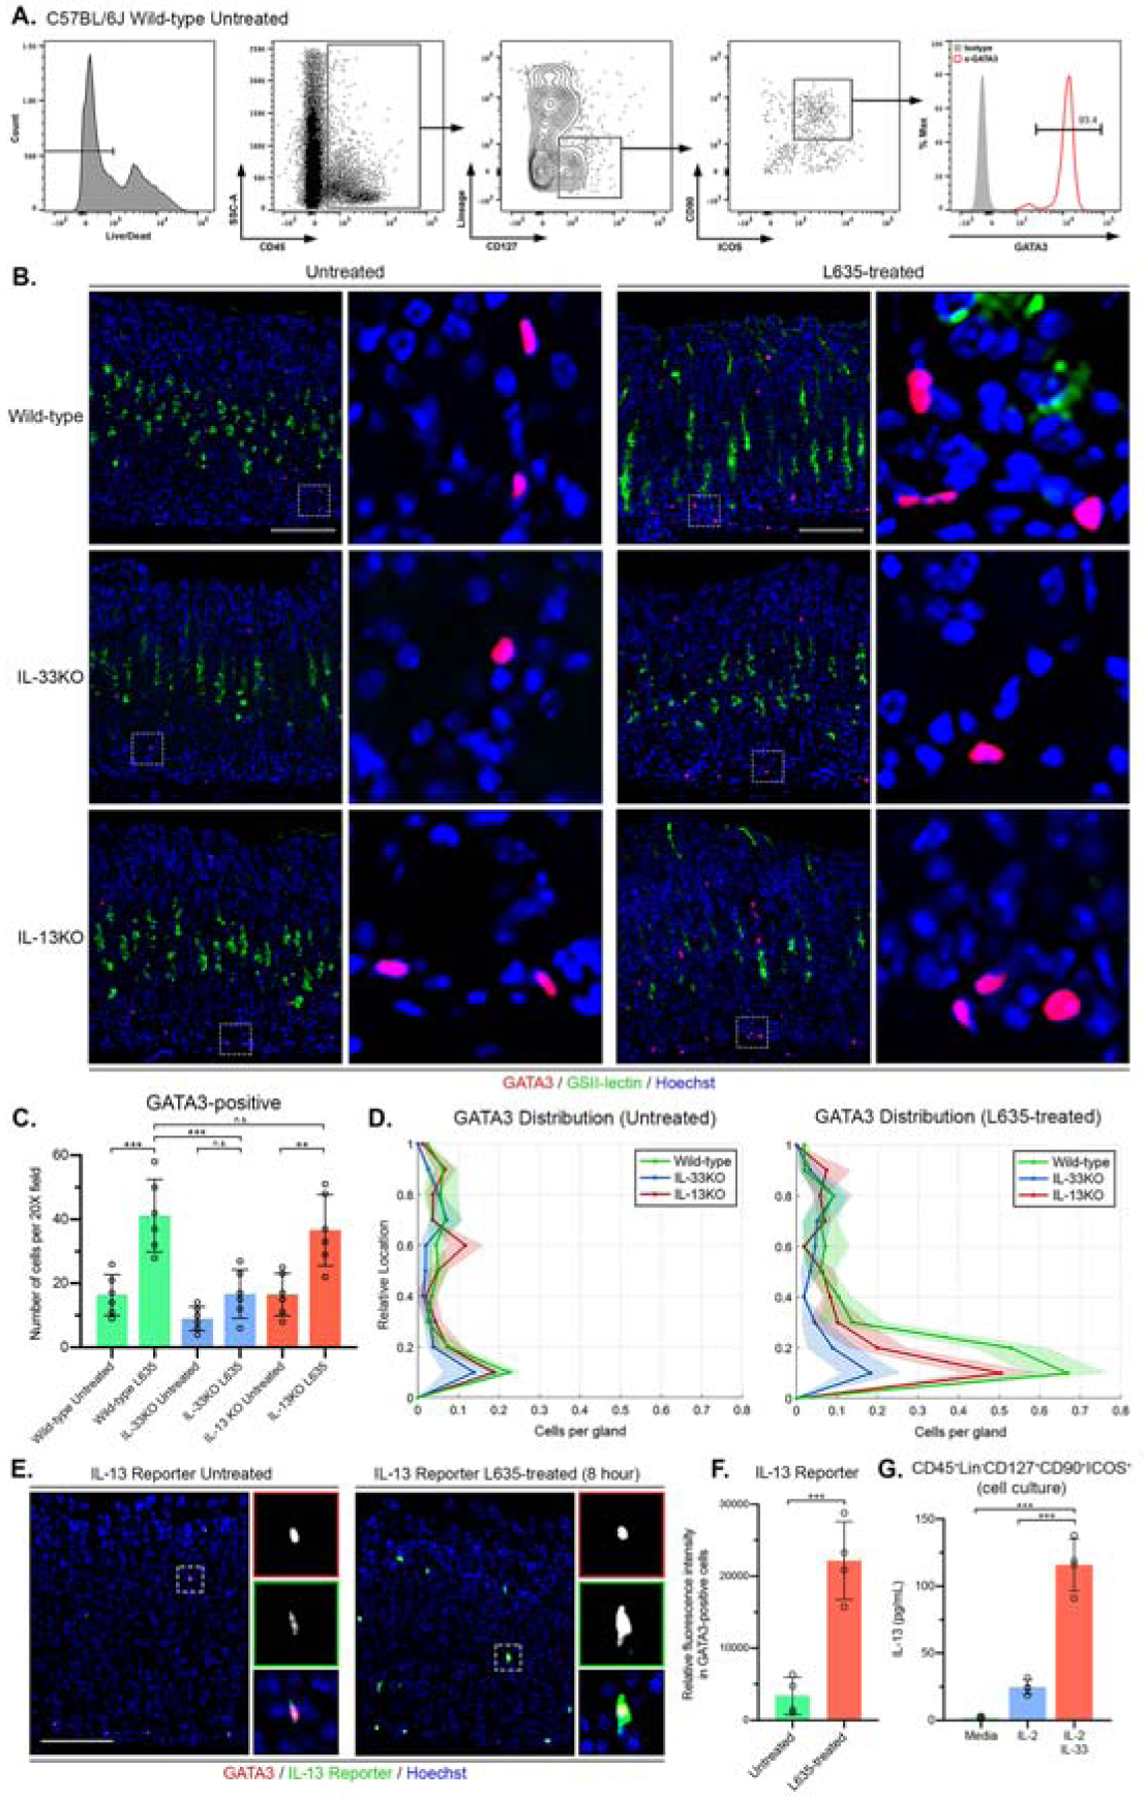
Figure 1. GATA3-positive ILC2s accumulate in the stomach after injury and secrete IL-13 in an IL-33 dependent manner.

(A) Flow cytometric analysis of isolated fixed cells from wild-type C57BL/6J mice. Greater than 93-percent of CD45⁺Lin-CD127+CD90+ICOS+ ILC2s are positive for GATA3. Rat IgG2b kappa antibody utilized as isotype control. (B) Representative images of immunostaining for GATA3 (red), mucin-6 containing granule marker GSII-lectin (green), with nuclear counter stain Hoechst (blue) in both untreated and L635-treated wild-type, IL-33KO, and IL-13KO mice (scale bars = 100 μm). Magnified inset of GATA3-positive ILC2s (right). (C) Quantification of GATA3-positive ILC2s per 20X objective field. (D) Location of GATA3-positive ILC2s from panel B is shown in distribution histograms with the y-axis representing the relative location within the gastric gland divided into 10% increments (1 = lumen and 0 = base) and the x-axis depicting the number of cells per gland. (E) Immunofluorescence staining for GATA3 (red), IL13 reporter (tdTomato, green), with nuclear counterstain Hoechst (blue) (scale bars = 100 μm). Magnified inset of GATA3-positive ILC2 (right). (F) Relative fluorescence intensity of the IL-13 reporter in GATA3-positive ILC2s. (G) Effects of IL-2 or IL-2 + IL-33 on IL-13 secretion from sorted primary gastric ILC2s (CD45⁺Lin-CD127+CD90+ICOS+). IL-13 production assayed by ELISA in media after 24 hours of incubation. Statistical significance determined by unpaired Student t test or one-way ANOVA with Bonferroni’s post-hoc multiple comparisons test. N.S. for not significant p ≥ 0.05, ** for p < 0.01, and *** for p < 0.001. Error bars represent mean ± SD.
