
Figure 2. Single cell RNA-sequencing of gastric ILC2s.
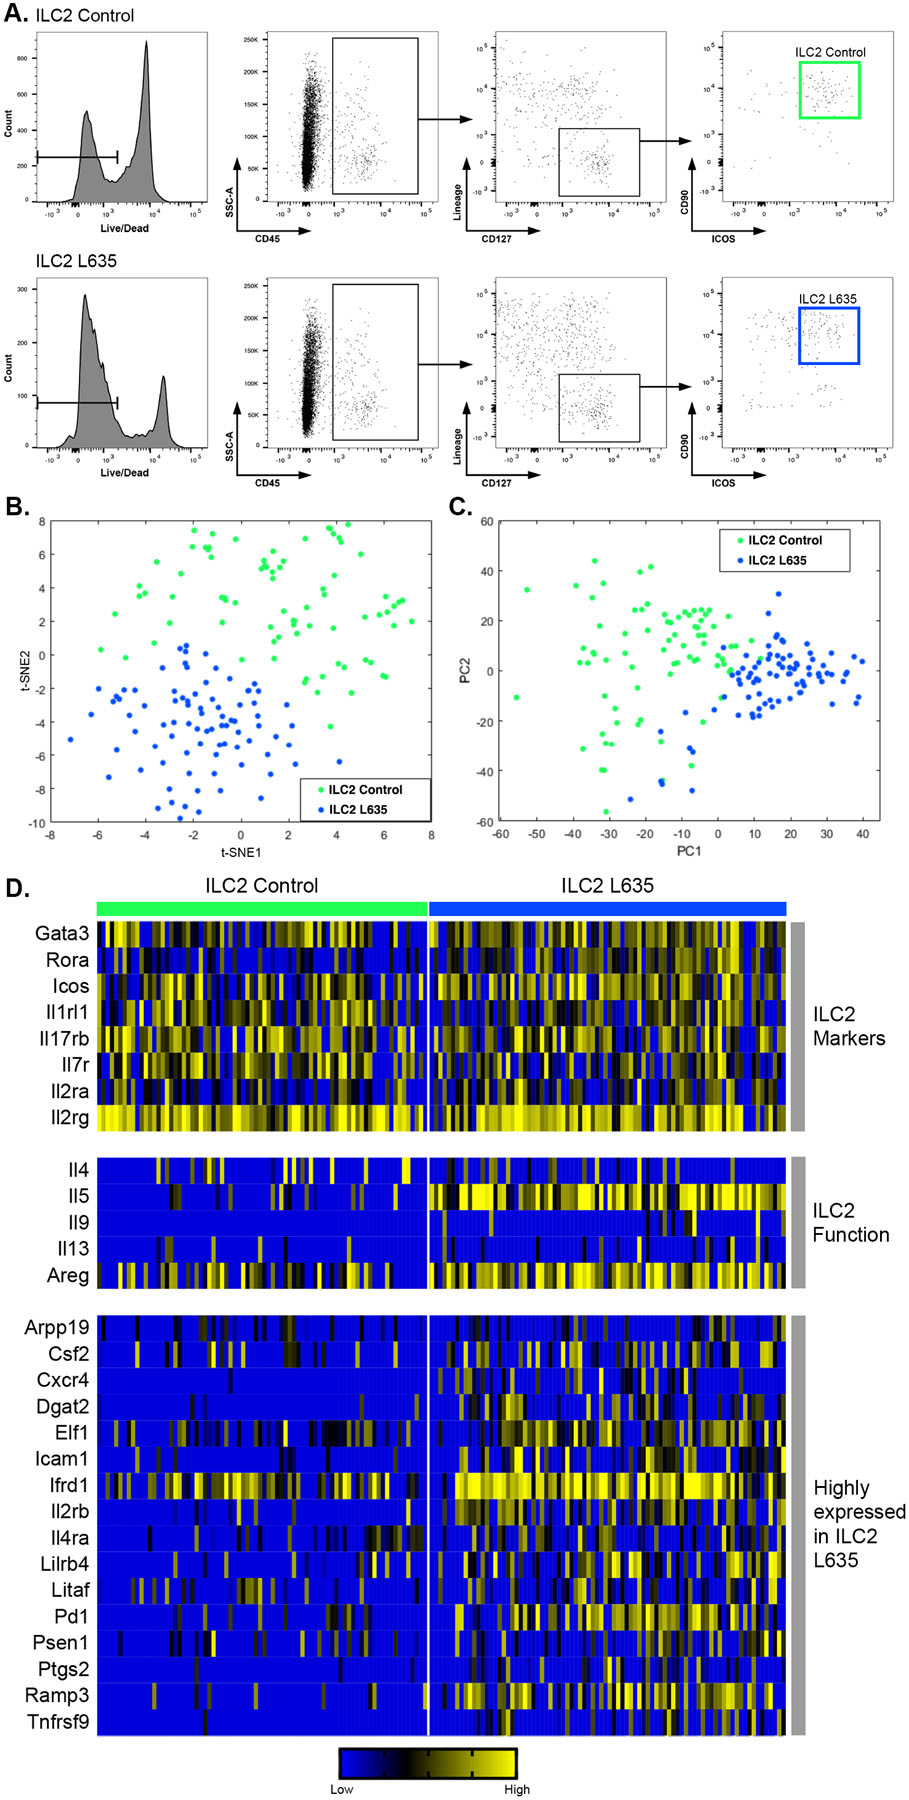
(A) Flow cytometric analysis of sorted single cells from wild-type untreated C57BL/6J mice (ILC2 Control) and wild-type C57BL/6J mice treated with one dose of L635 and sacrificed 24 hours after administration (ILC2 L635). (B) t-SNE plots and (C) principle component analysis of ILC2 Control (green) and ILC2 L635 (blue). (D) A heatmap of single cell RNA-seq data for eight ILC2 marker genes, five genes involved in ILC2 function, and sixteen genes that were identified as being highly expressed in ILC2 L635.