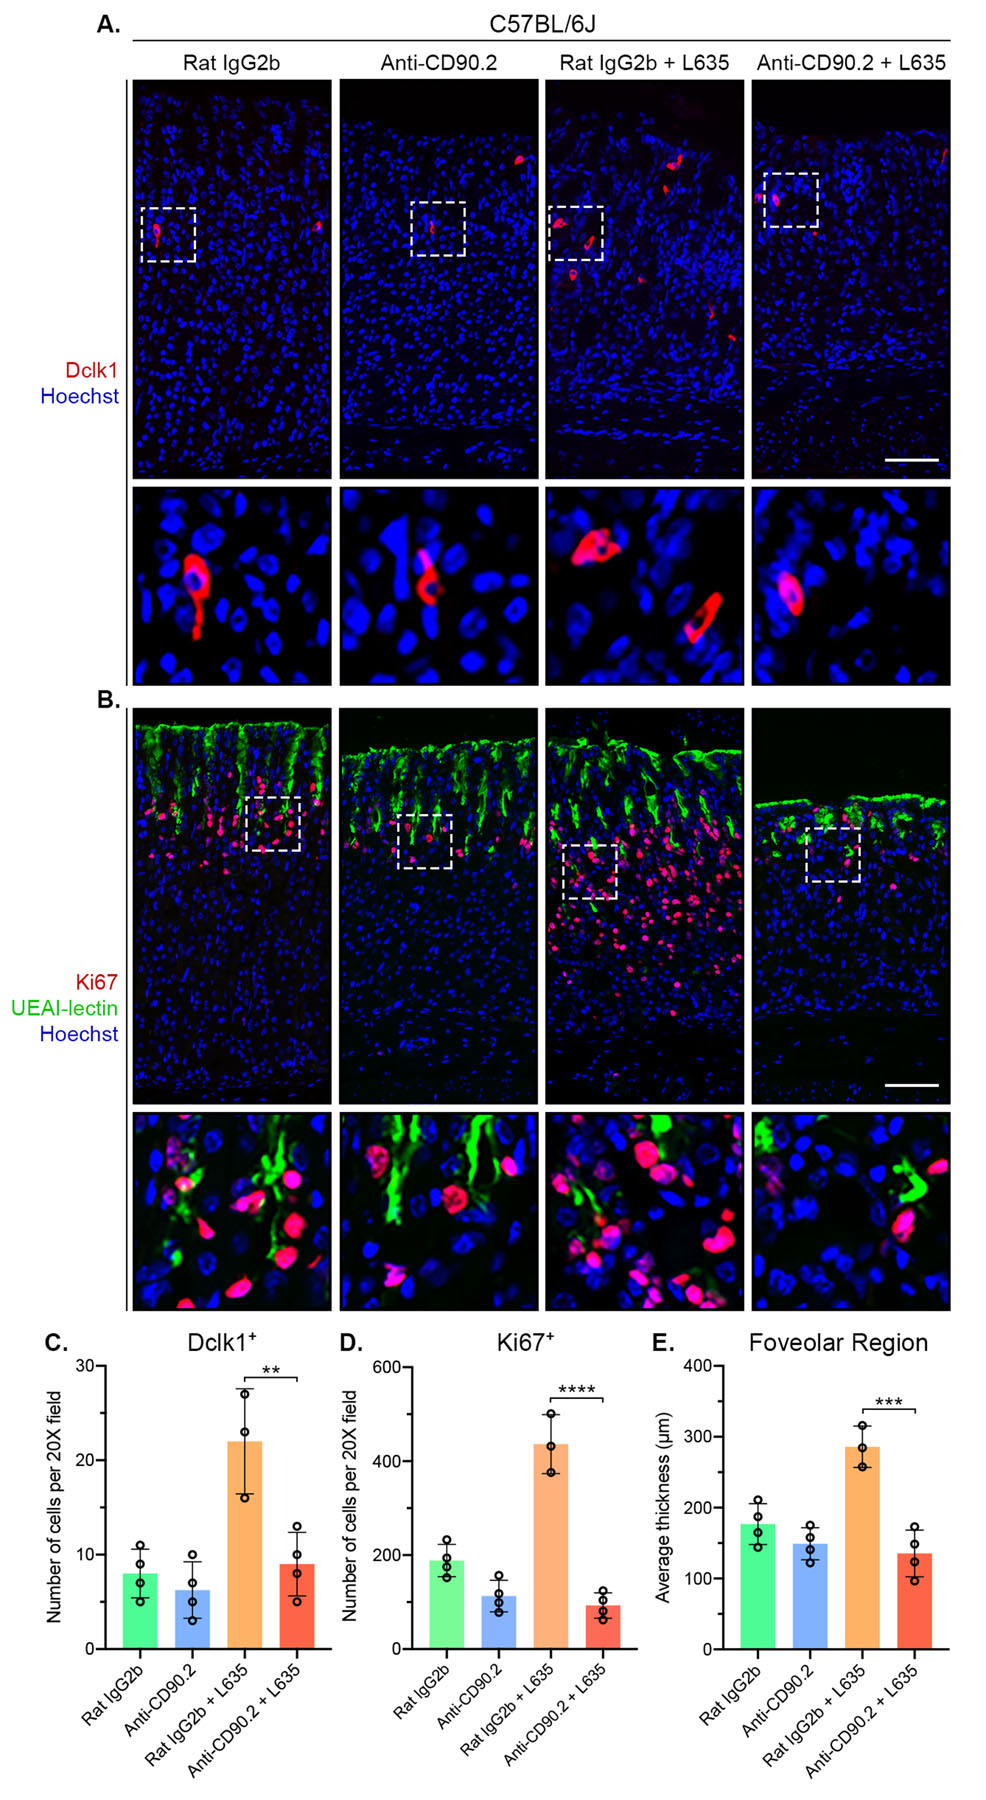
Figure 5. ILC2 depletion inhibits L635-induced foveolar/tuft cell hyperplasia and proliferation.

Immunostained sections from Rat IgG2b (n=4), Anti-CD90.2 (n=4), Rat IgG2b + L635 (n=3), and Anti-CD90.2 + L635 (n=4) treated C57BL/6J mice. (A) Representative images of tuft cell marker Dclk1 (red) with nuclear counter stain Hoechst (blue) (scale bars = 100 μm). Magnified inset of Dclk1-positive tuft cells (bottom). (B) Representative images of proliferation marker Ki67 (red), foveolar cell marker UEAI-lectin (green), with nuclear counter stain Hoechst (blue) (scale bars = 100 μm). Magnified inset of gland isthmus (bottom). Quantification of (C) Dclk1-positive tuft cells and (D) Ki67-positive proliferating cells per 20X objective field. (E) Average thickness (μm) of UEAI-lectin-positive foveolar region. Statistical significance determined by one-way ANOVA with Bonferroni’s post-hoc multiple comparisons test. ** for p < 0.01, *** for p < 0.001, and **** for p < 0.0001. Error bars represent mean ± SD.
