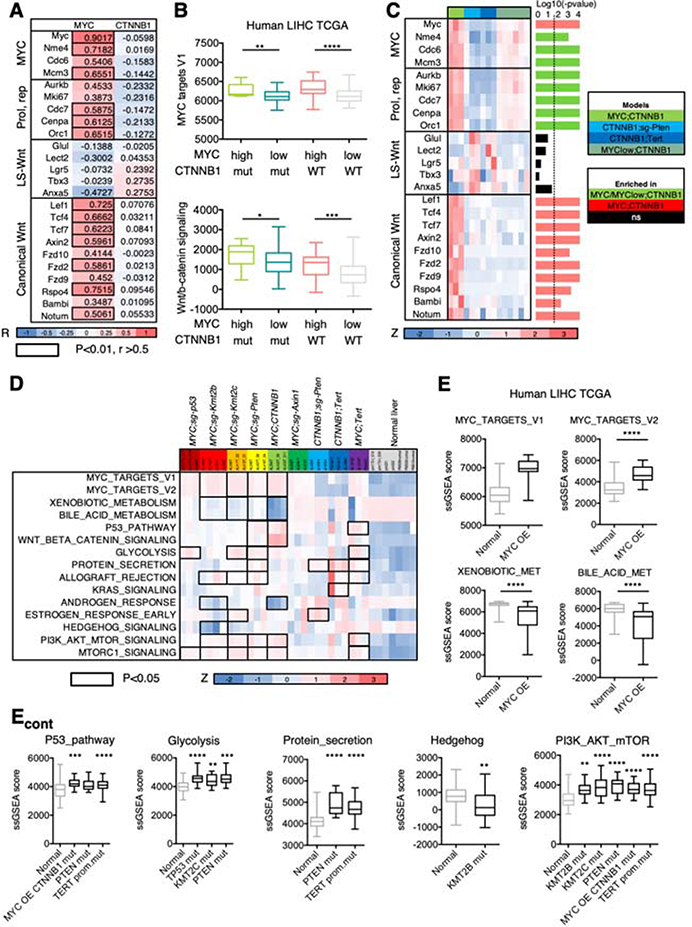
Figure 5. Inter-tumor heterogeneity is shaped by oncogene expression levels and specific cooperating events.
(A) Heatmap showing the Pearson R values for the correlation between transposon-driven MYC or CTNNB1 mRNA levels and expression of the indicated genes. Color code is shown under the heatmap. The correlation values that are higher than 0.5 and with a P-value lower than 0.01 are highlighted with the black outline. R, Pearson correlation coefficient. LS, liver specific; Prol, proliferation; rep, replication. (B) Box and whisker plot representing ssGSEA values for MYC targets and Wnt/β-catenin signatures in HCC patients stratified depending on the MYC mRNA levels (high, 1st quartile; low, 2nd-4th quartiles) and CTNNB1 mutational status (mut, mutated; WT, wild-type). Mann-Whitney test. MYC high CTNNB1 mutant n=15; MYC low CTNNB1 mutant n=34; MYC high CTNNB1 wild-type n=30; MYC low CTNNB1 mutant n=104. (C) Heatmap of gene expression values (shown as Z score) in the different murine HCCs expressing β-catenin. The P-value for each gene is shown in the right (bar graph) (Anova). The dotted line indicates the threshold for significance after applying Benjamini-Hochberg multiple testing correction (p < 0.019). Color code is shown under the heatmap and on the right. (D) Heatmap of ssGSEA values (shown as Z score) for representative pathways in the different murine HCCs and normal livers. Color code is shown under the heatmap. Black outlines indicate gene sets that are significantly different in the corresponding model compared to normal liver (Anova test). (E) Bar graphs showing the ssGSEA score in human HCC samples from TCGA with genetic alterations in the indicated gene and compared to normal livers from GTEX. Mann-Whitney test or Anova test. MYC OE (overexpression) n=31, normal liver n=136; MYC OE CTNNB1 mut (mutant) n=16; PTEN mut n=12; TERT prom.mut (promoter mutation) n=80; TP53 mut n=58; KMT2C mut n=16; KMT2B mut n=12.

