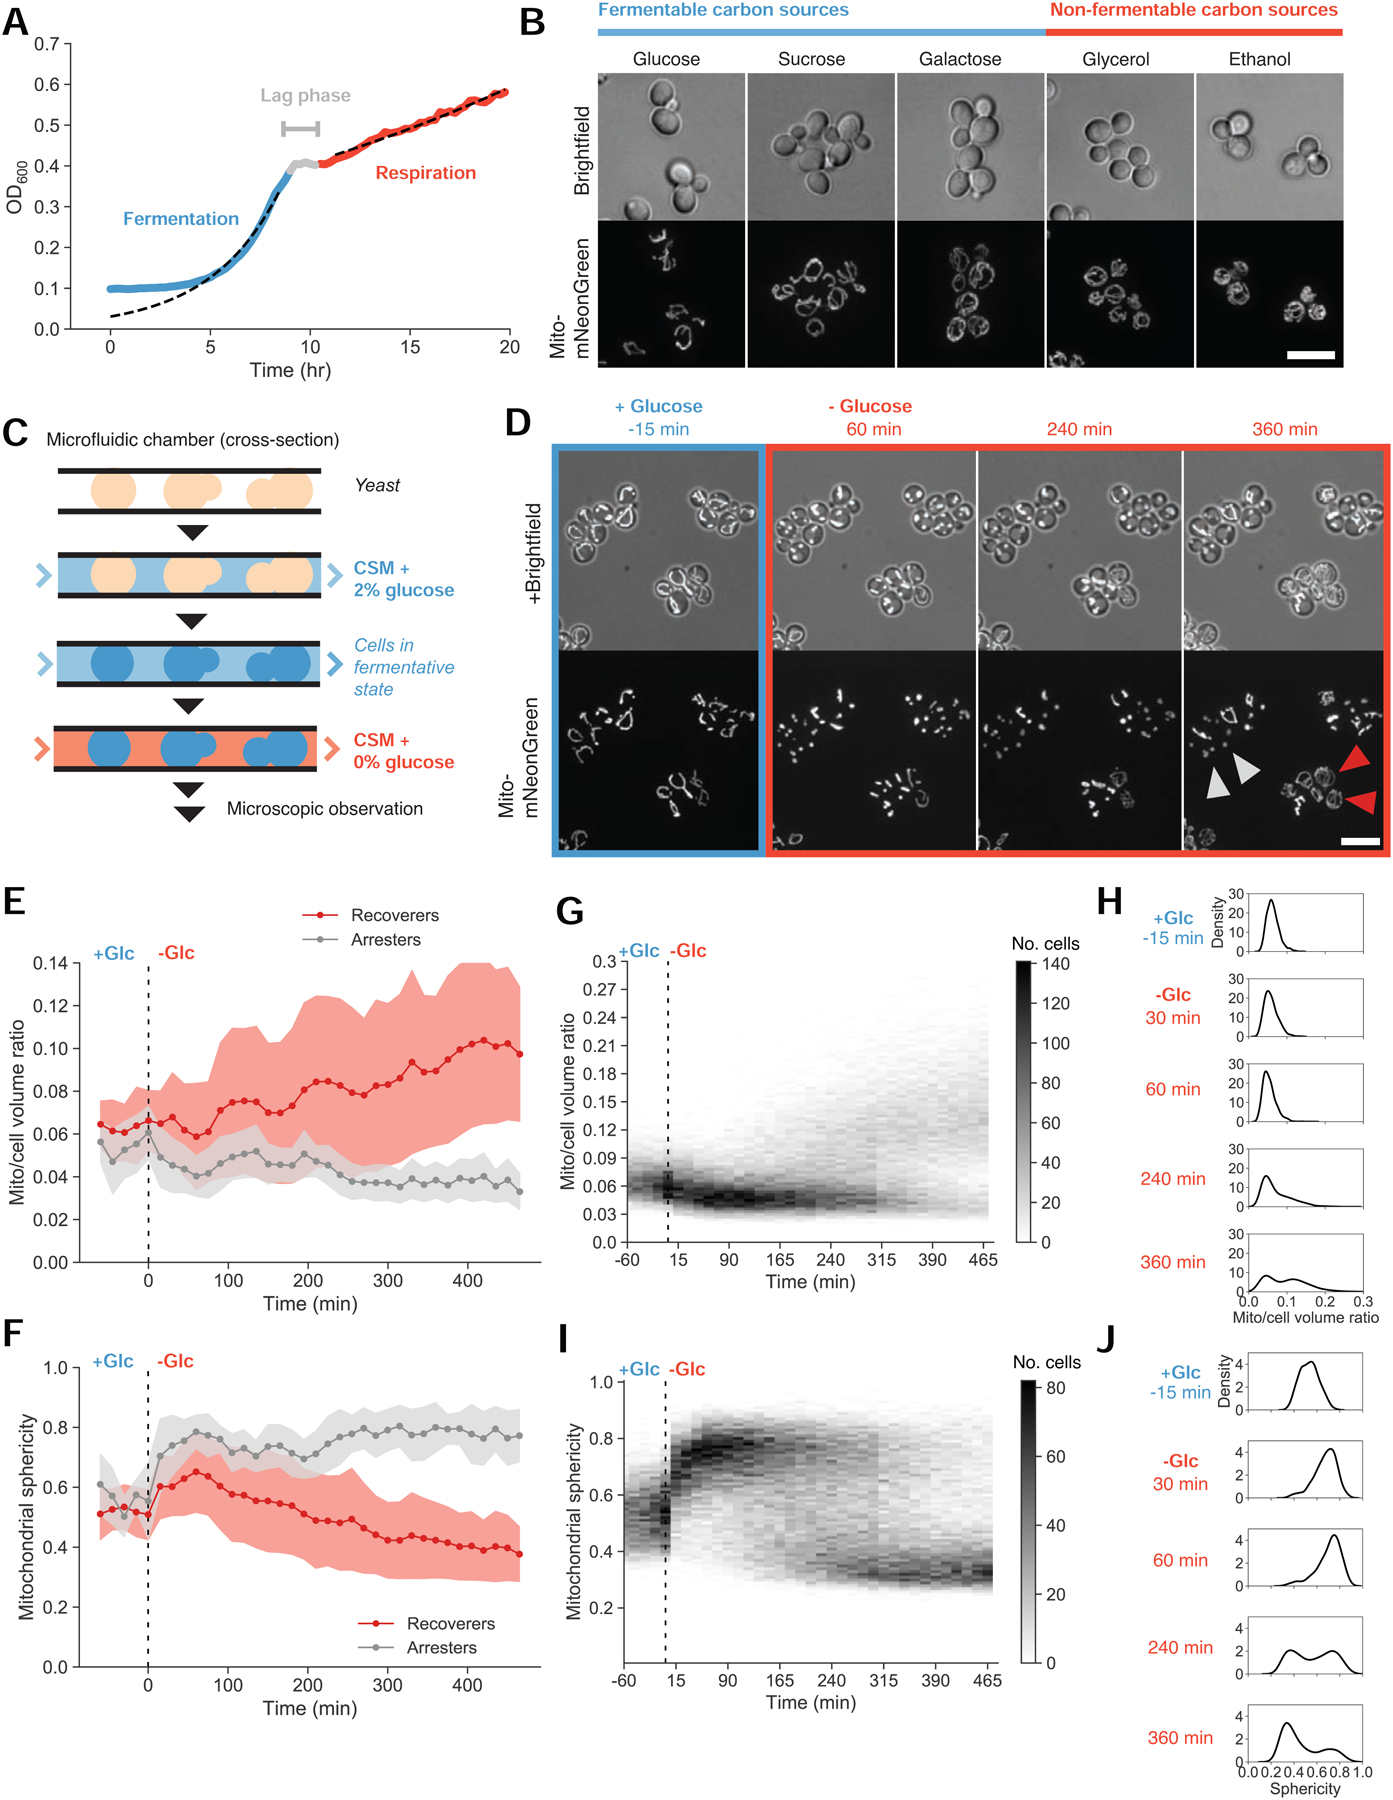
Figure 1. Heterogeneity in mitochondrial size scaling and structural integrity track with growth stalling during fermentative-to-respiratory transitions.

(A) Typical yeast fermentative and respiratory growth dynamics, expressed as the optical density of a batch yeast culture (yLB126) measured on a plate reader with continuous shaking. Dotted lines depict exponential fits to the indicated blue and red regions.
(B) Mitochondrial networks visualized by matrix-targeted mNeonGreen fluorescent protein (mito-mNeonGreen) (yLB126) in exponentially-growing yeast cells in synthetic media with indicated carbon sources. Scale bar, 10 μm.
(C) Experimental setup. Cells were immobilized in microfluidic plates and supplied with synthetic medium containing 2% glucose by continuous perfusion, promoting glucose repression and permitting fermentative growth. Cells were observed by microscopy during this pregrowth period and following abrupt replacement of the source medium with synthetic medium containing 0% glucose.
(D) Representative images of mito-mNeonGreen (yLB126) in high glucose and followed by abrupt switch to glucose-free medium. Labeled cells indicate examples of recoverer cells, which adapt and perform mitochondrial biogenesis (red arrows), and arrester cells, with extended mitochondrial collapse (gray arrows). Scale bar, 10 μm.
(E) Distributions of the ratio of mitochondrial to total cell volume for phenotypic classes above for all cells in the field of view in (D). Filled bands indicate one standard deviation from the mean. These sample trajectories are representative of 13 independent experiments as displayed in (G) and (H).
(F) Distributions of mitochondrial sphericity index (ratio of surface area of hypothetical sphere with the same volume as a mitochondrion to its actual surface area) for phenotypic classes in (D), in a given sample field of view. Filled bands indicate one standard deviation.
(G) and (H) Time-resolved heat maps of mitochondrial/cell volume ratio (G) and mitochondrial sphericity (H) in N = 1,329 cells, collected across 13 independent experiments, before and during acute glucose starvation beginning at 0 min. Intensity reflects absolute number of cells within the binning area.
(I) and (J) Histograms of mitochondrial/cell volume ratio (I) and sphericity (J) at the indicated time points from (G) and (H) displaying bimodality in mitochondrial morphology following glucose withdrawal.
