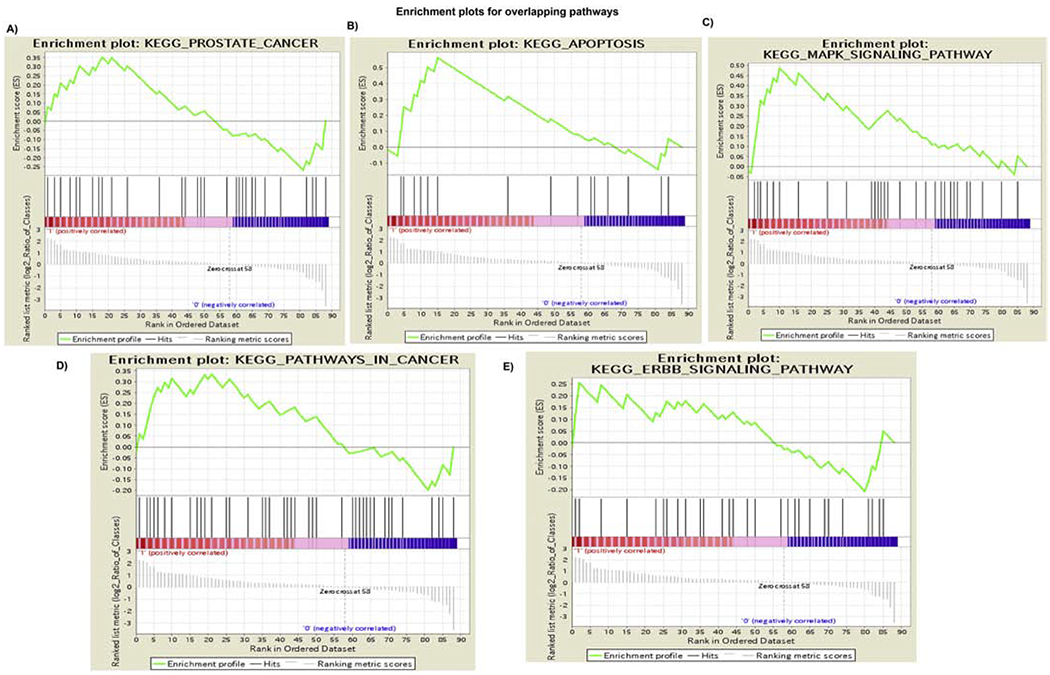
Figure 4. Gene set enrichment analysis (GSEA) for the characterization of gene expression in Cd-exposed compared to normal controls.

Cd-RWPE1 is denoted as “1” and parental normal RWPE1 as “0” in the plots. Five overlapping pathways are enriched in Cd-RWPE1 vs. Parental RWPE1 as control. These pathways are KEGG_Prostate cancer Pathway (A). KEGG_Apoptosis (B). KEGG_MAPK (C). KEGG_Pathways in cancer (D). KEGG_ERBB (E) pathways. Same pathways were enriched in Cd-PWR1E vs. normal parental PWR1E cells (Supplemental Figures 1 and 2).
