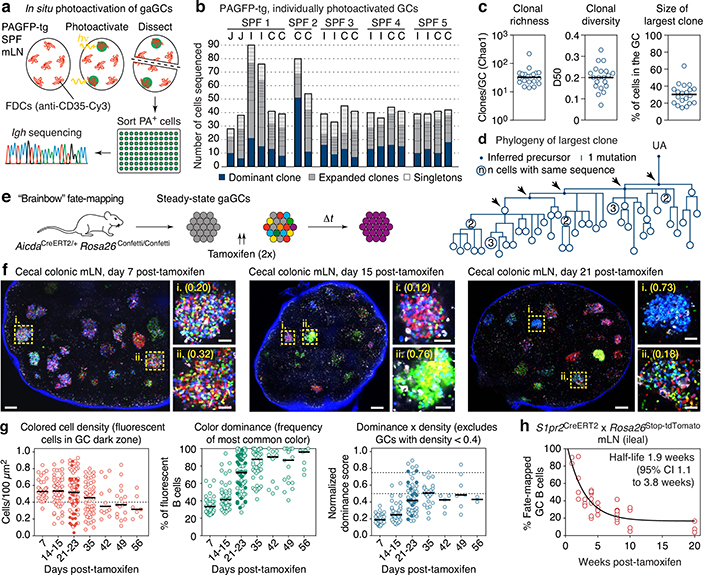
Fig. 1 |. Kinetics of clonal selection in steady-state gaGCs.
(a) Experimental setup. (b) Clonal composition of individual GCs from five mice (SPF1–5) obtained as in (a). J, jejunal; I, ileal; C, cecal-colonic mLN. (c) Quantification of data in (a-b). Each symbol represents one GC. Median indicated. (d) Igh sequence relationship among B cells from the largest B cell clone in the sample. Arrows indicate putative positive selection events. UA, unmutated ancestor. (e) Experimental setup. (f) Multiphoton images of mLN of SPF mice at different times after tamoxifen treatment. Blue is collagen (2nd harmonics), white is autofluorescence, other colors are from the Confetti allele. Scalebars, 200 μm (overviews), 50 μm (close-ups). (g) Quantification of images as in (f). Each symbol is one GC. Only GCs with density > 0.4 fluorescent cells/100 μm2 are included in NDS calculation. Filled symbols indicate data from two mice in which tamoxifen was administered intraperitoneally. Median indicated. Data are from 3–5 mice per timepoint at days 14–35 and 1–2 mice for day 7 and later timepoints. (h) SPF S1pr2CreERT2 x Rosa26Stop-tdTomato mice were given 2 doses of tamoxifen, 2 days apart, to label GC B cells. Graph shows proportion of tdTomato+ mLN GC B cells assayed by flow cytometry at the timepoint indicated, counting from the first dose of tamoxifen. Each symbol represents one mouse. Half-life was quantified using a one-phase exponential decay function (black line). Gating strategies detailed in Extended Data Fig. 1a–c.

