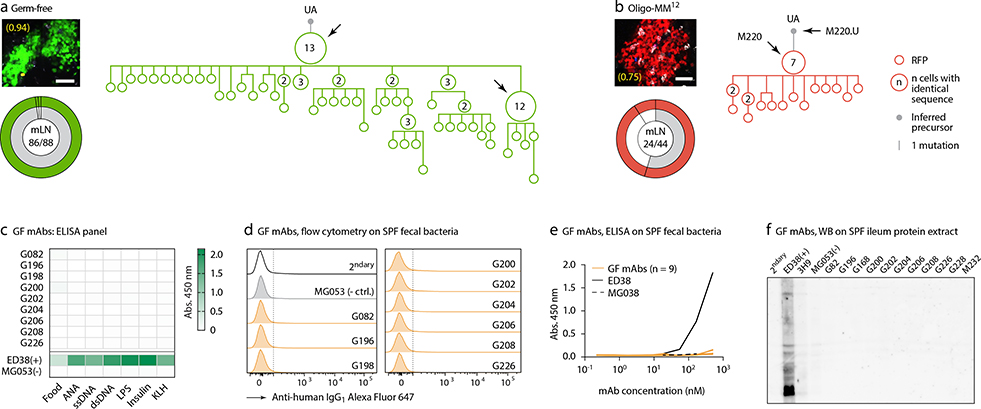
Extended Data Figure 6. Characteristics of ‘winner’ gaGC clones from GF and Oligo-MM12-colonized mice.
(a,b). Additional Igh sequence relationships among B cells from high-NDS GCs from GF (a) and Oligo-MM12-colonized (b) mice. Details as in Fig. 2a. Scalebars, 50 μm. (c) Reactivity summary of GF mAbs assayed by ELISA against food protein extracts, autoantigens (anti-nuclear antibody, ANA), and a 5-antigen polyreactivity panel. Shown are background subtracted OD 450nm values. (d) Flow cytometry of GF mAbs binding to fecal bacteria from SPF mice. Details as in Fig. 2b. (e) ELISA for GF mAbs binding to SPF fecal bacterial fractions. MG053 was assayed at 3 dilutions only. mAbs were assayed at the dilution indicated in the X-axis. Lines are mean of two assays. (f) Western blot (WB) for GF mAbs binding to a protein extract from mouse ileum tissue, run on a single-well 4–15% gel and blotted using a multi-well mask. mAb 3H9 is a DNA-specific negative control. Data in (c-f) are representative of two or more independent experiments.

